Different views to understand BLE tag tracking
Overview of different views to help understand BLE tag tracking.
Several views, available as tabs on a single selected device, can help you understand or troubleshoot how a BLE tracking solution is operating.
Any BLE tag tracking solution strongly depends on consistent, reliable scanning of BLE signals. When first deploying such a solution, or when the result is not what you expect, a first step is to investigate whether the scanning is reliable - using the views described below.
These technical-oriented views are available depending on the capabilities of the device, and how it is configured.
BLE Scan history (for any scanning device)
This view is available for every device that is configured to do BLE scanning (so this can be an infrastructure device, a vehicle tracker, or a battery powered tracker).
The purpose of this view is troubleshooting and investigation.
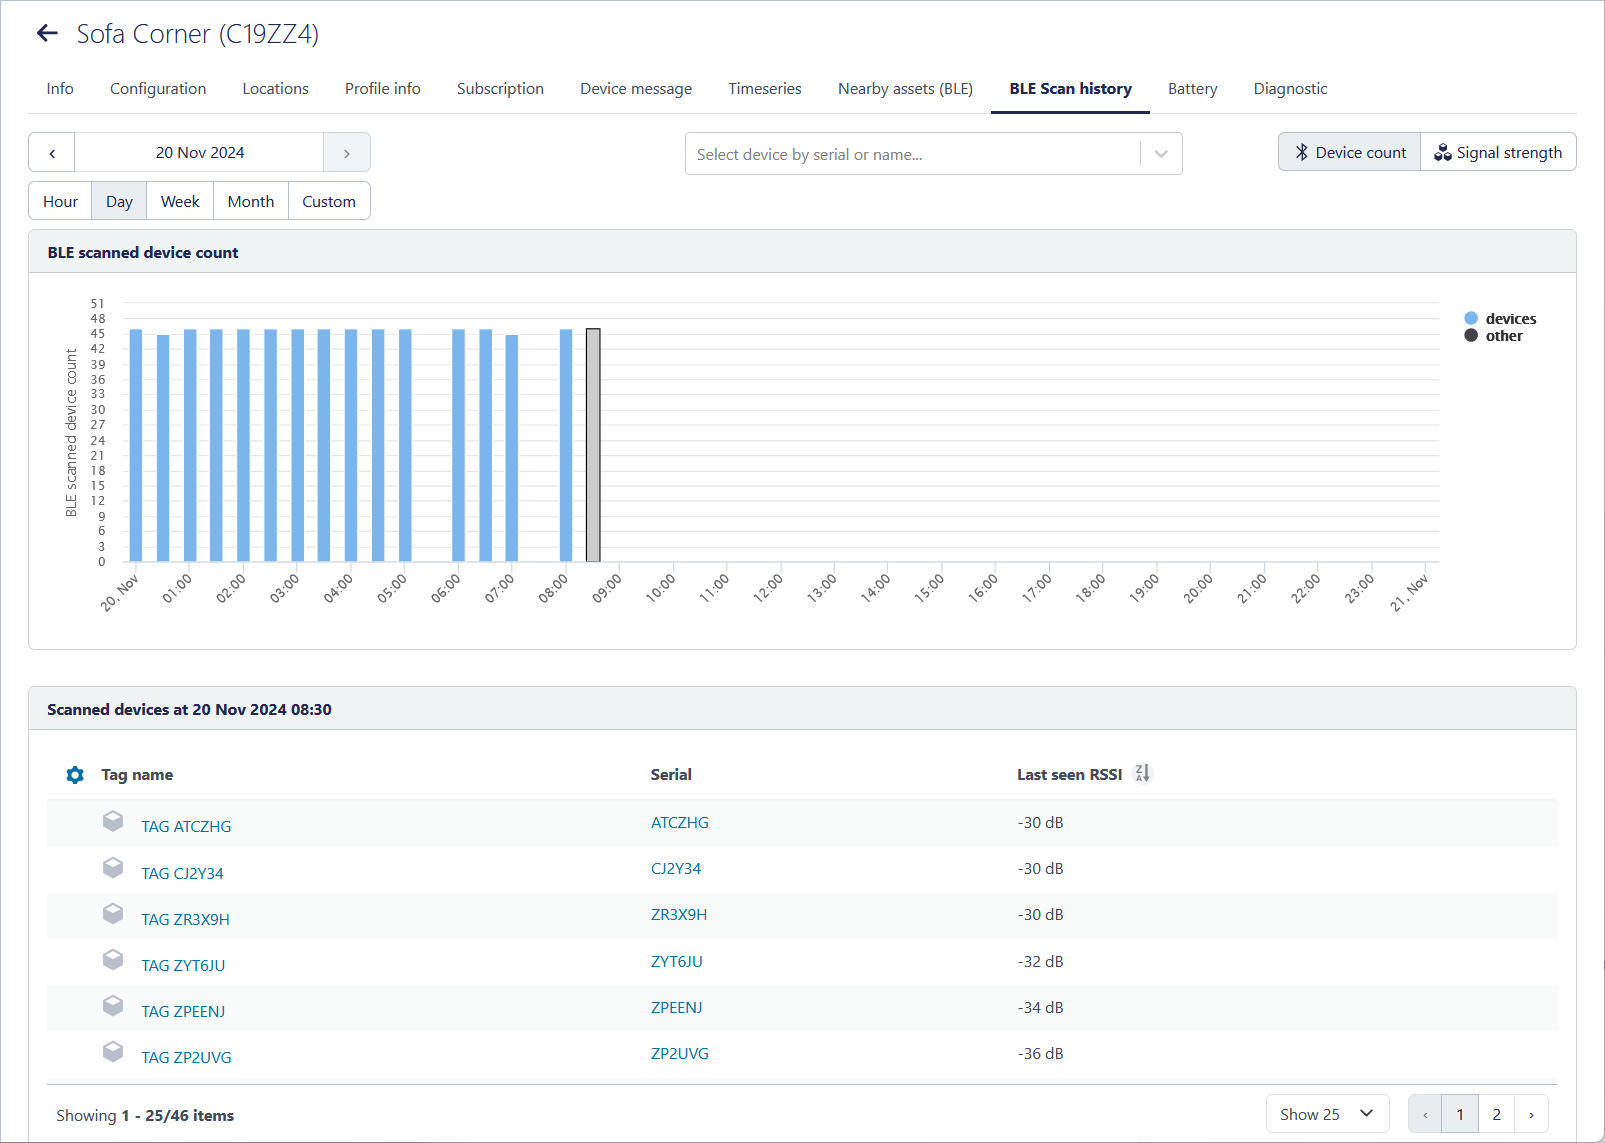
- BLE scanned device count: A chart shows the number of scanned devices over time.
- Below the chart, a list of scanned devices on a particular timestamp is available.
- Click any point in time in the chart to have the list display what was scanned at the selected time.
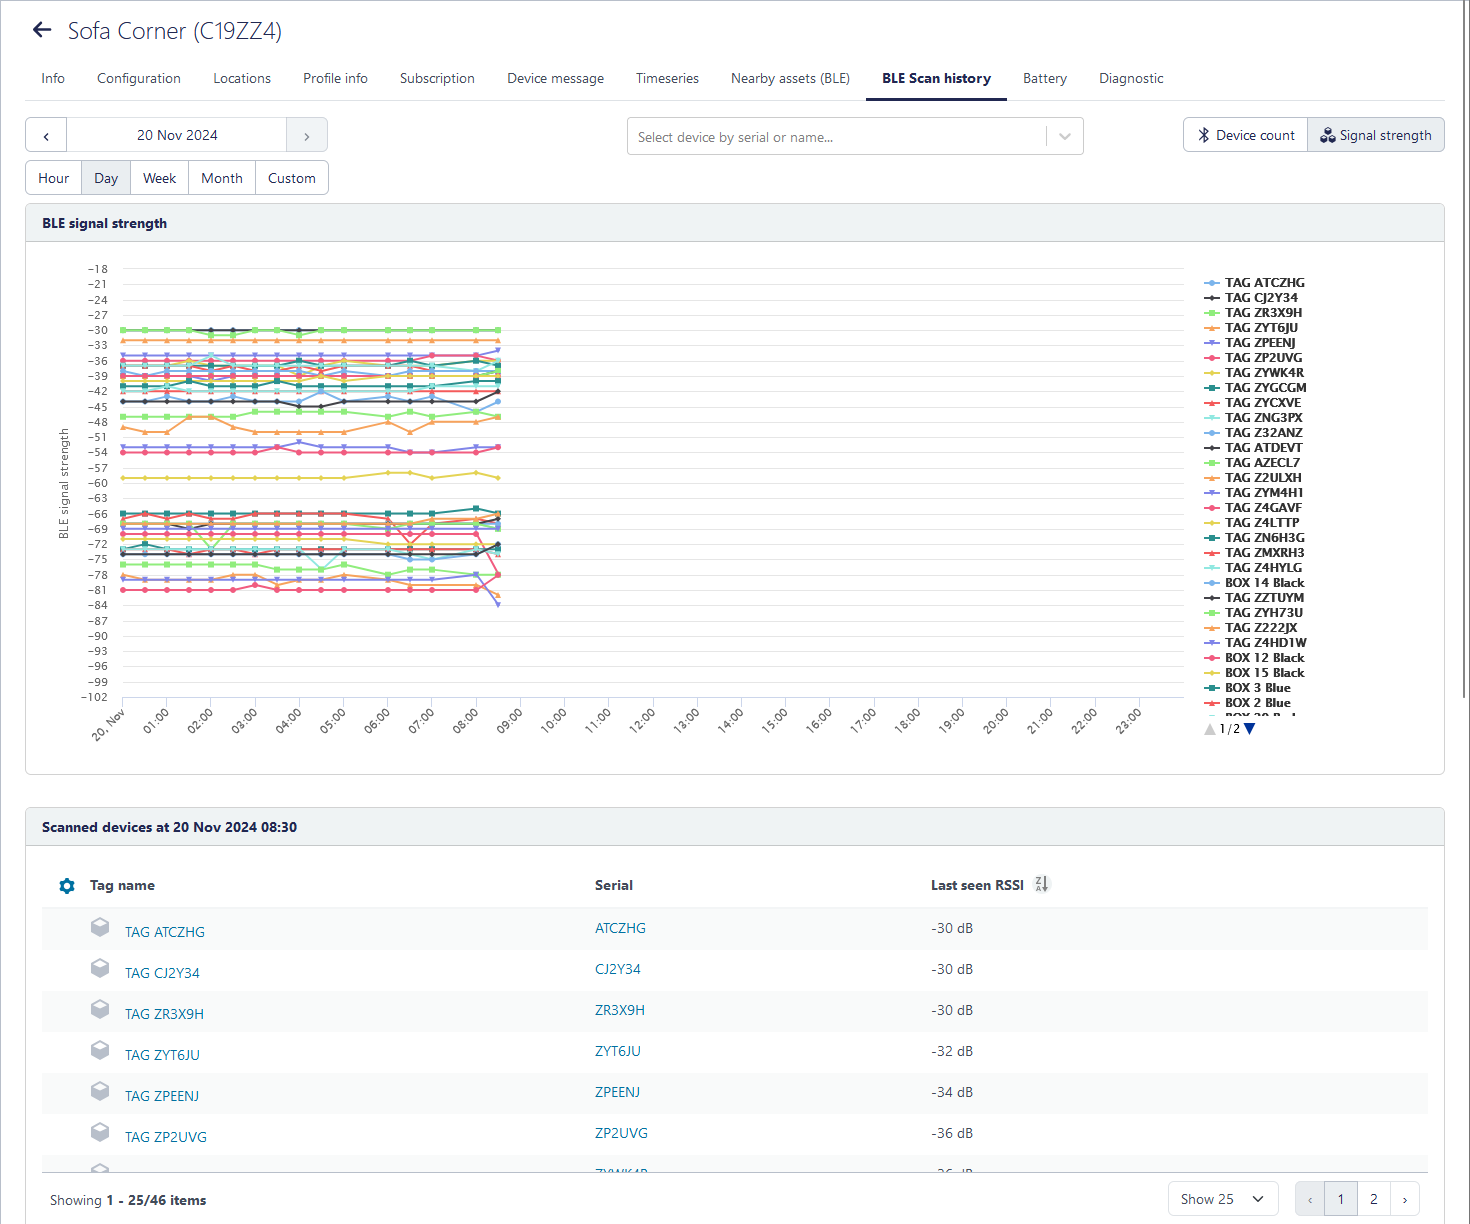
- The chart can also be toggled to show the RSSI strength over time.
- Using the filter, you can filter on individual scanned assets. This is useful if investigating a (few) single assets from a larger amount of assets.
Please be aware that the correct grouping per scan cycle can deviate per scanning device type. Some scanning devices types do not provide accurate scan time information the observations are split among multiple messages.
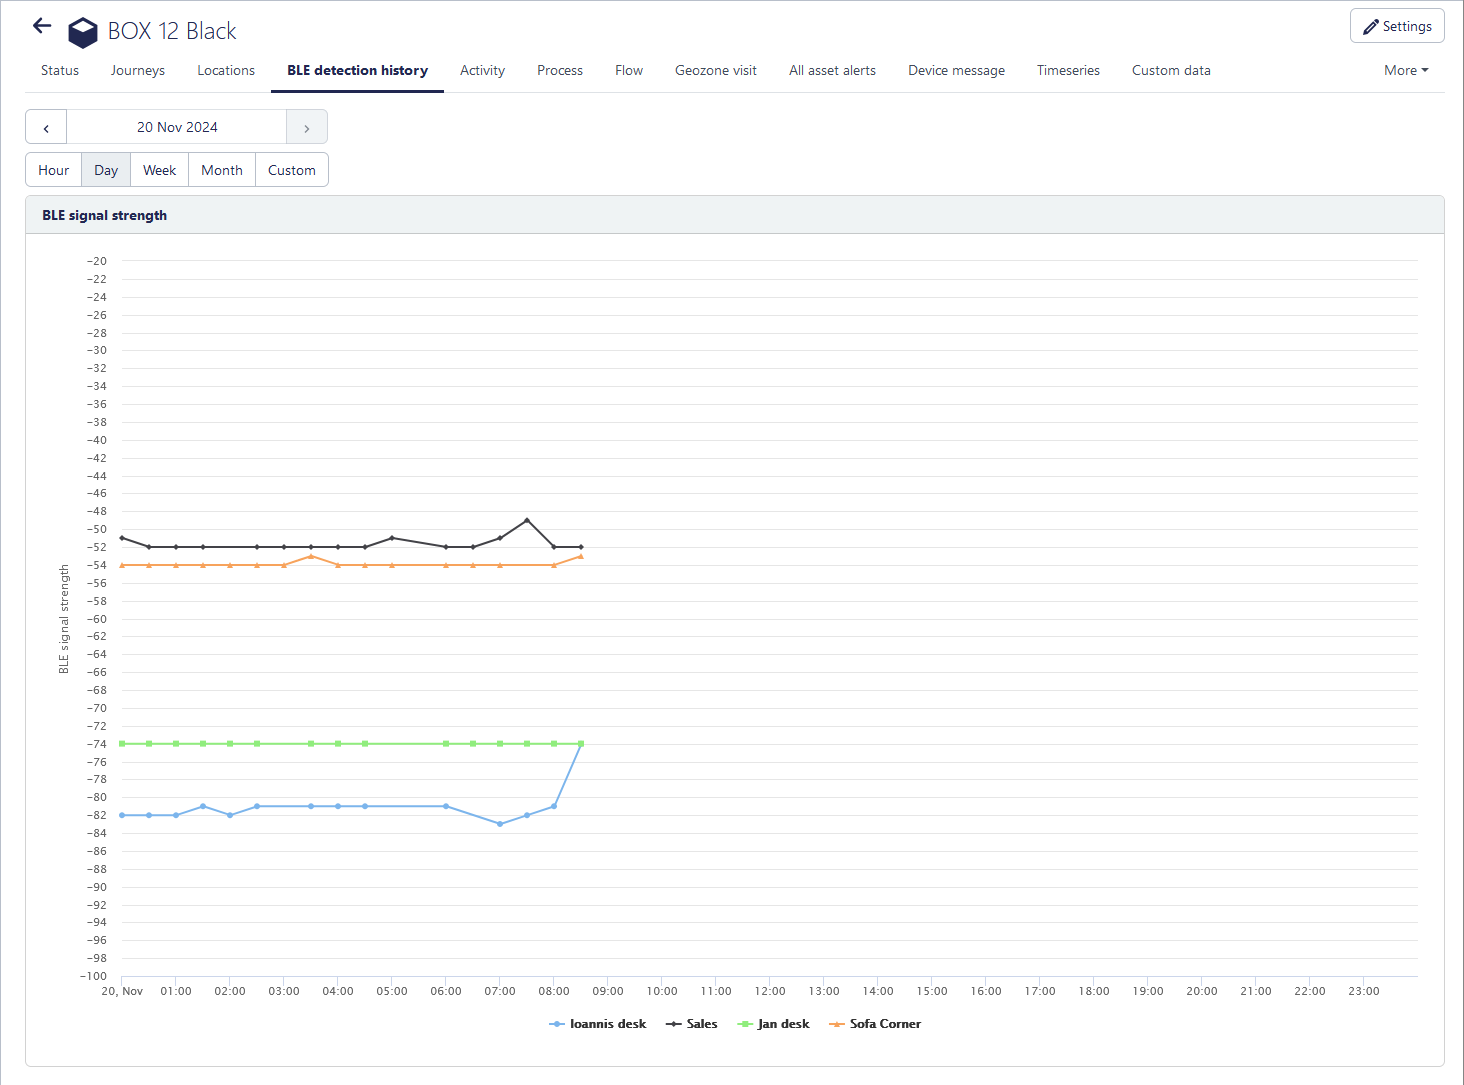
BLE detection history (for single scanned device)
This view is available for every device that are scanned by BLE scanning devices - like an asset tracked with a BLE tag. It reveals the signal strength (RSSI) at which the device is scanned by different scanning devices over time.
The purpose of this view is troubleshooting and investigation.
Nearby Assets (BLE) (for zone anchor mode)
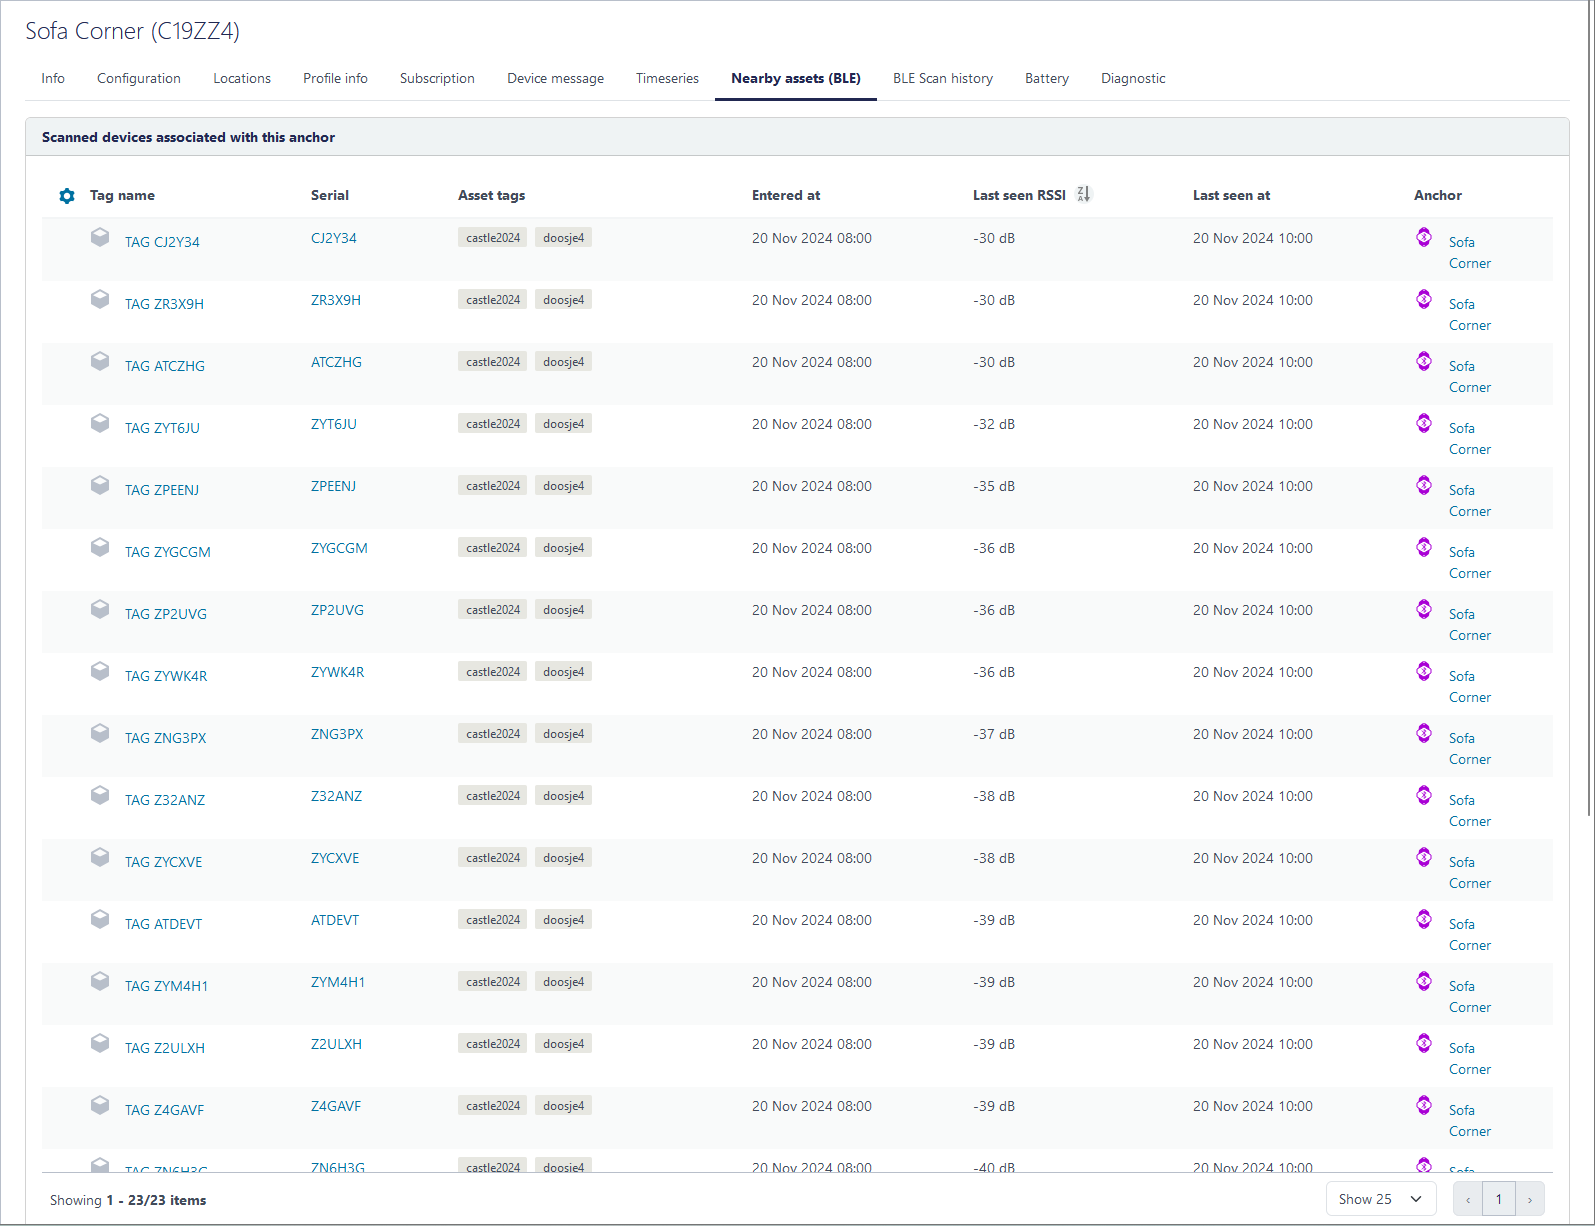
This view is available scanning devices that are configured to perform “zone-anchor mode scanning”, generating ENTER-EXIT locations on the BLE tags.
The purpose of this view is for end-users (not technical), to know which assets are near a zone anchor. Ideally, this individual anchor view is not important, and users would look on the asset map or at the geozone level. But in single-zone anchor cases, it can sometimes be useful for end-users to use this particular view.
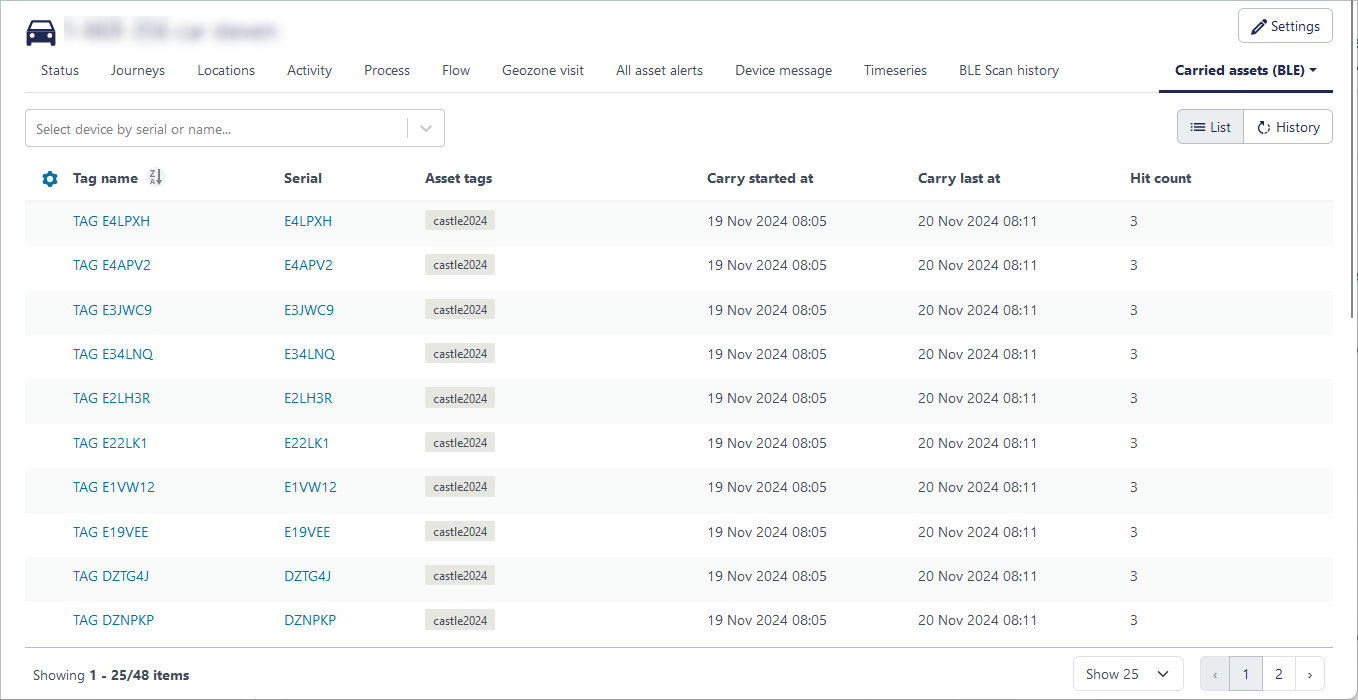
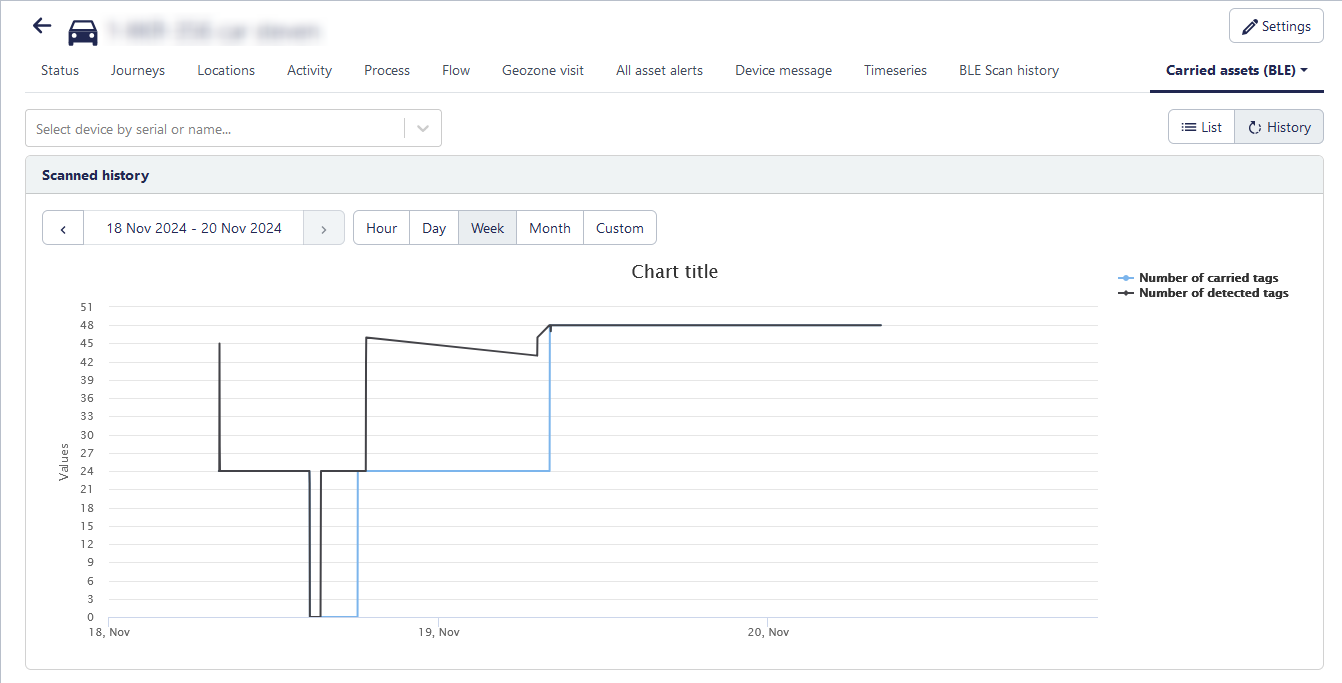
Carried Assets (BLE) (for scanning vehicle trackers)
This view is available for BLE scanning vehicle trackers configured to scan in ‘carry mode’
The term ‘carry’, is currently quite technical. Expect further improvements in the Sensolus platform to how assets transported by BLE scanning vehicle trackers are visualized to end-users. Carry mode scanning means that for a vehicle tracker, an advanced algorithm is used to determine which assets are effectively transported by the vehicle as it moves - versus assets that are only observed occasionally in the vicinity to BLE scans while the vehicle is in pick-up or drop-off zones. Also, this reduces the otherwise excessive location data that multiple nearby vehicles would generate.
