Process insights
What is a views related to processes? What can be seen at asset level and what can be seen at global level?
Overall view
At an overall level there are set of views that provide insights for every process.
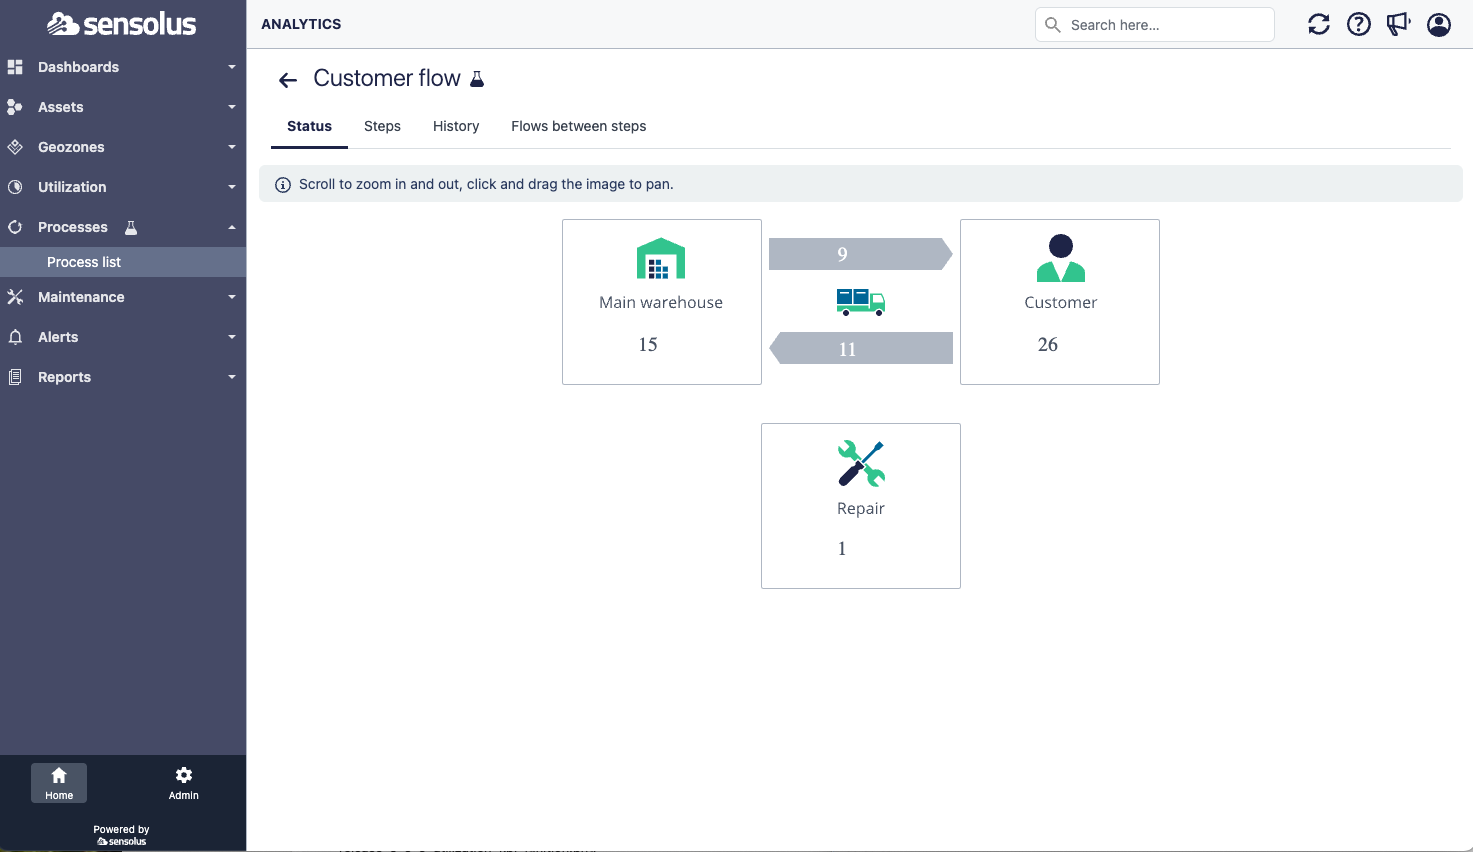
The status view shows visually how many assets are in every process step. This view is available when the process definition contains an SVG template.
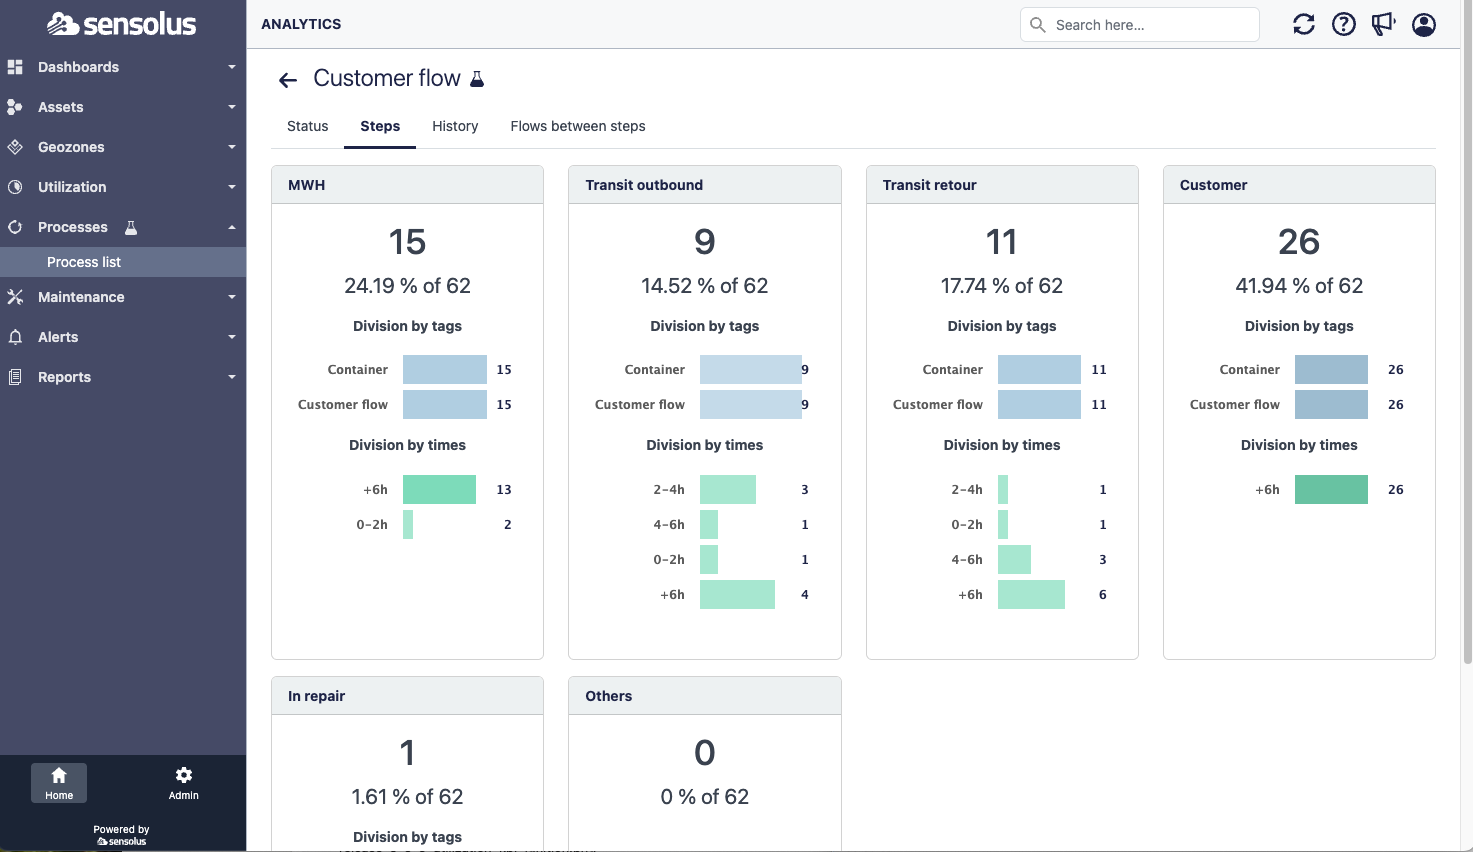
The process steps tab gives an overview of every process step. It shows the number of a assets in every step and a breakdown both by asset tag and by duration the asset is already in the step. The special block others is reserved for assets that are linked to the process but not yet associated to any proces step.
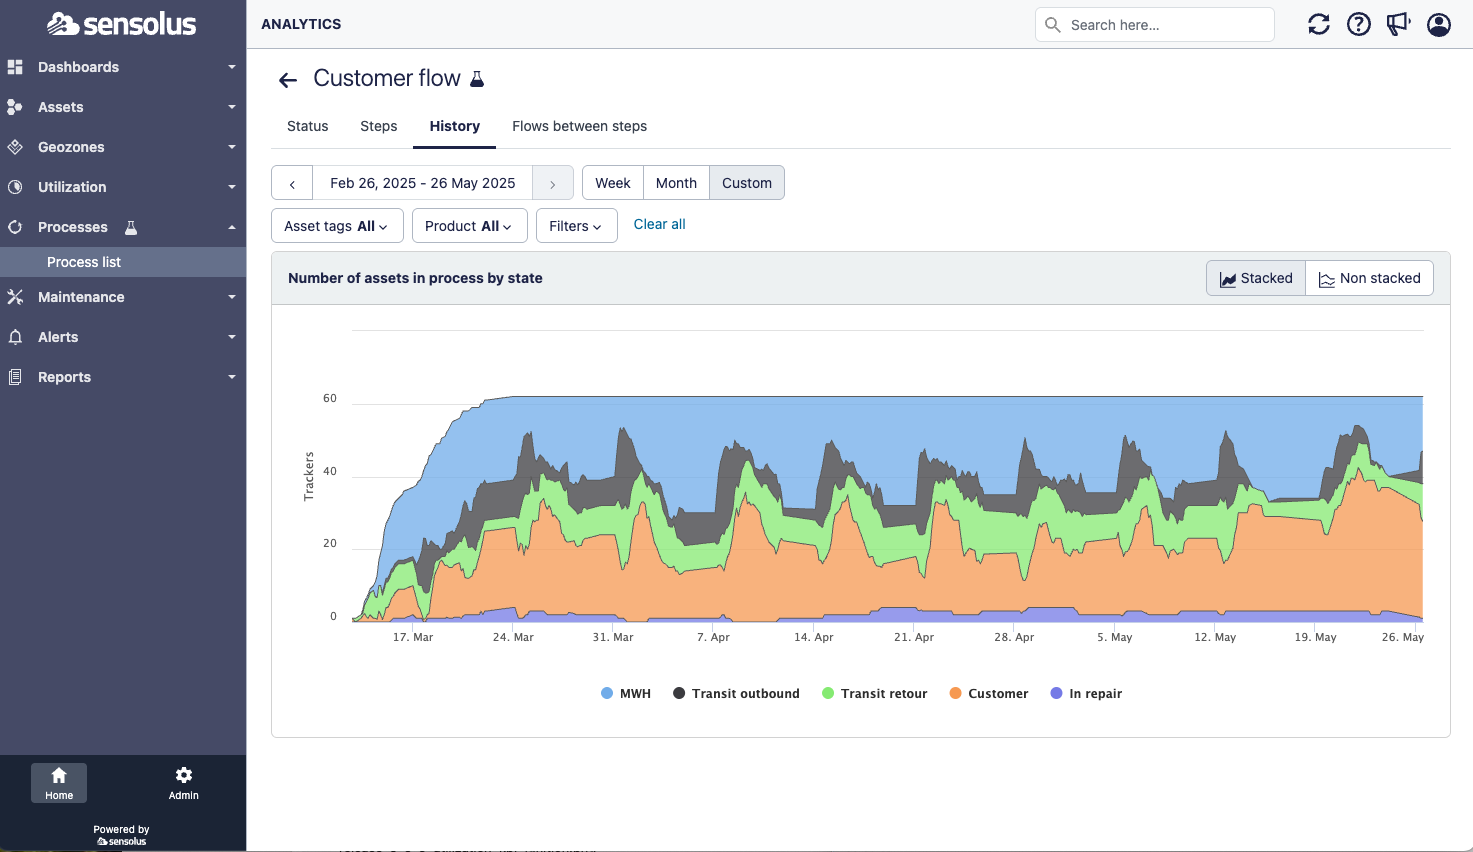
The process history tab shows how many assets are in a certain step over time. If the number of assets is stable one would expect the stacked view to have a fixed max value. The view allows to switch between stacked and non stacked view. If a point on the graph is clicked the exact set of assets at that time will be rendered
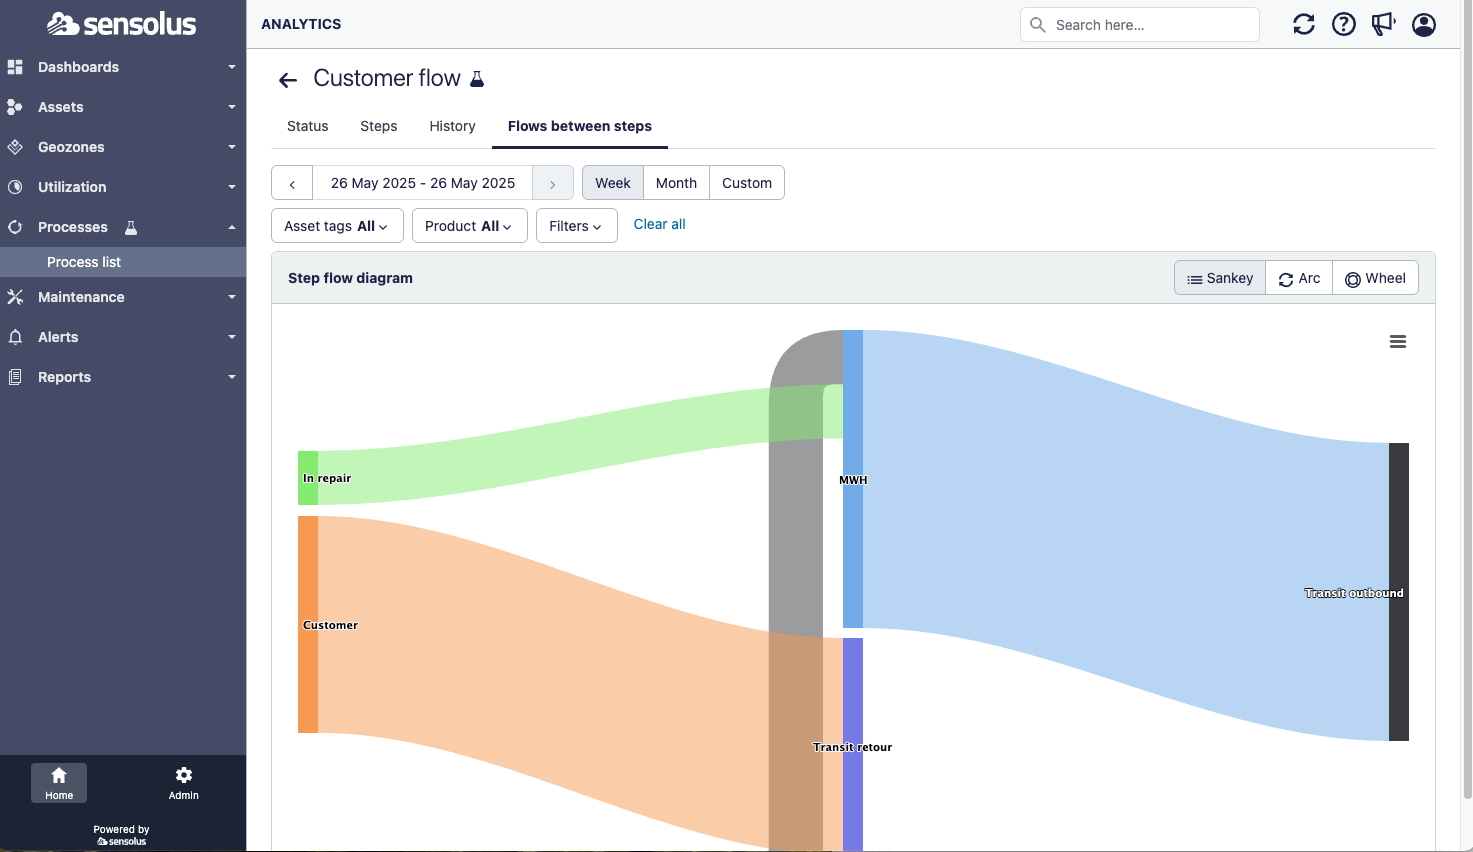
This tab shows the transitions from one step to another. There is a very similar visualization on geozone visits. It can be used to identify visually what are the dominant transitions and which are the more exceptional transitions.