Utilization insights on asset fleet
Explanation on how to navigate to the page with asset fleet utilization insights.
Show insights in the platform
- Navigate to
 Home → Utilization → Utilization overview
 - Select the Utilization KPI you want to see by clicking the

.png) Note: An utilization KPI has one of the following states (1) Ready: the dashboard with the utilization KPI's is ready and available, just click on the eye to access it. (2) Initializing: our system is still generating the utilization KPI dashboard, wait until it is marked as 'Ready' to take a look; (3) Delete: the dashboard with the utilization KPI is being deleted and will soon dissapear.
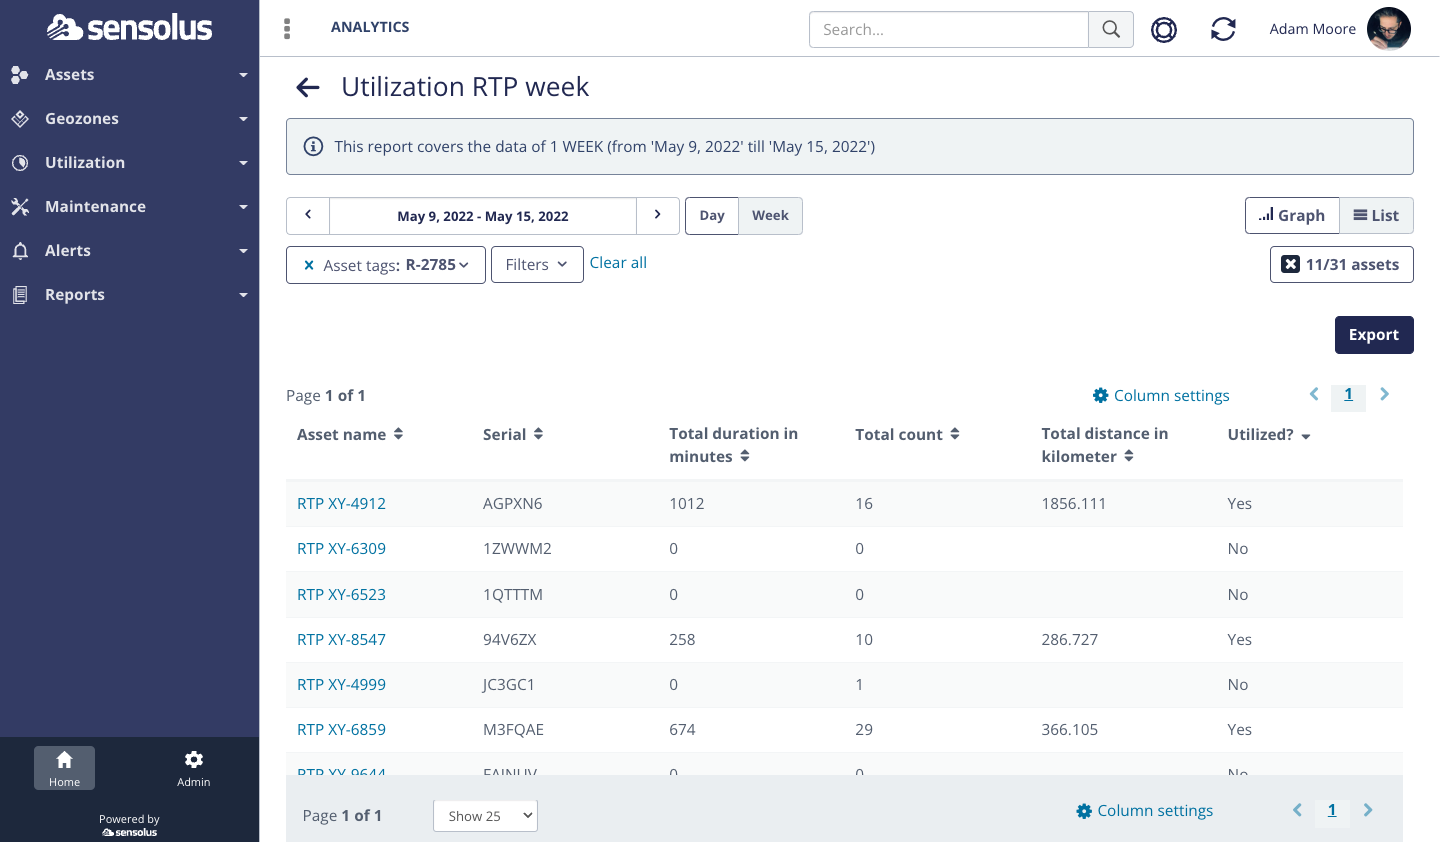
Note: An utilization KPI has one of the following states (1) Ready: the dashboard with the utilization KPI's is ready and available, just click on the eye to access it. (2) Initializing: our system is still generating the utilization KPI dashboard, wait until it is marked as 'Ready' to take a look; (3) Delete: the dashboard with the utilization KPI is being deleted and will soon dissapear. - You can choose between list view and graph view
 . Change the time frame in the utilization report.
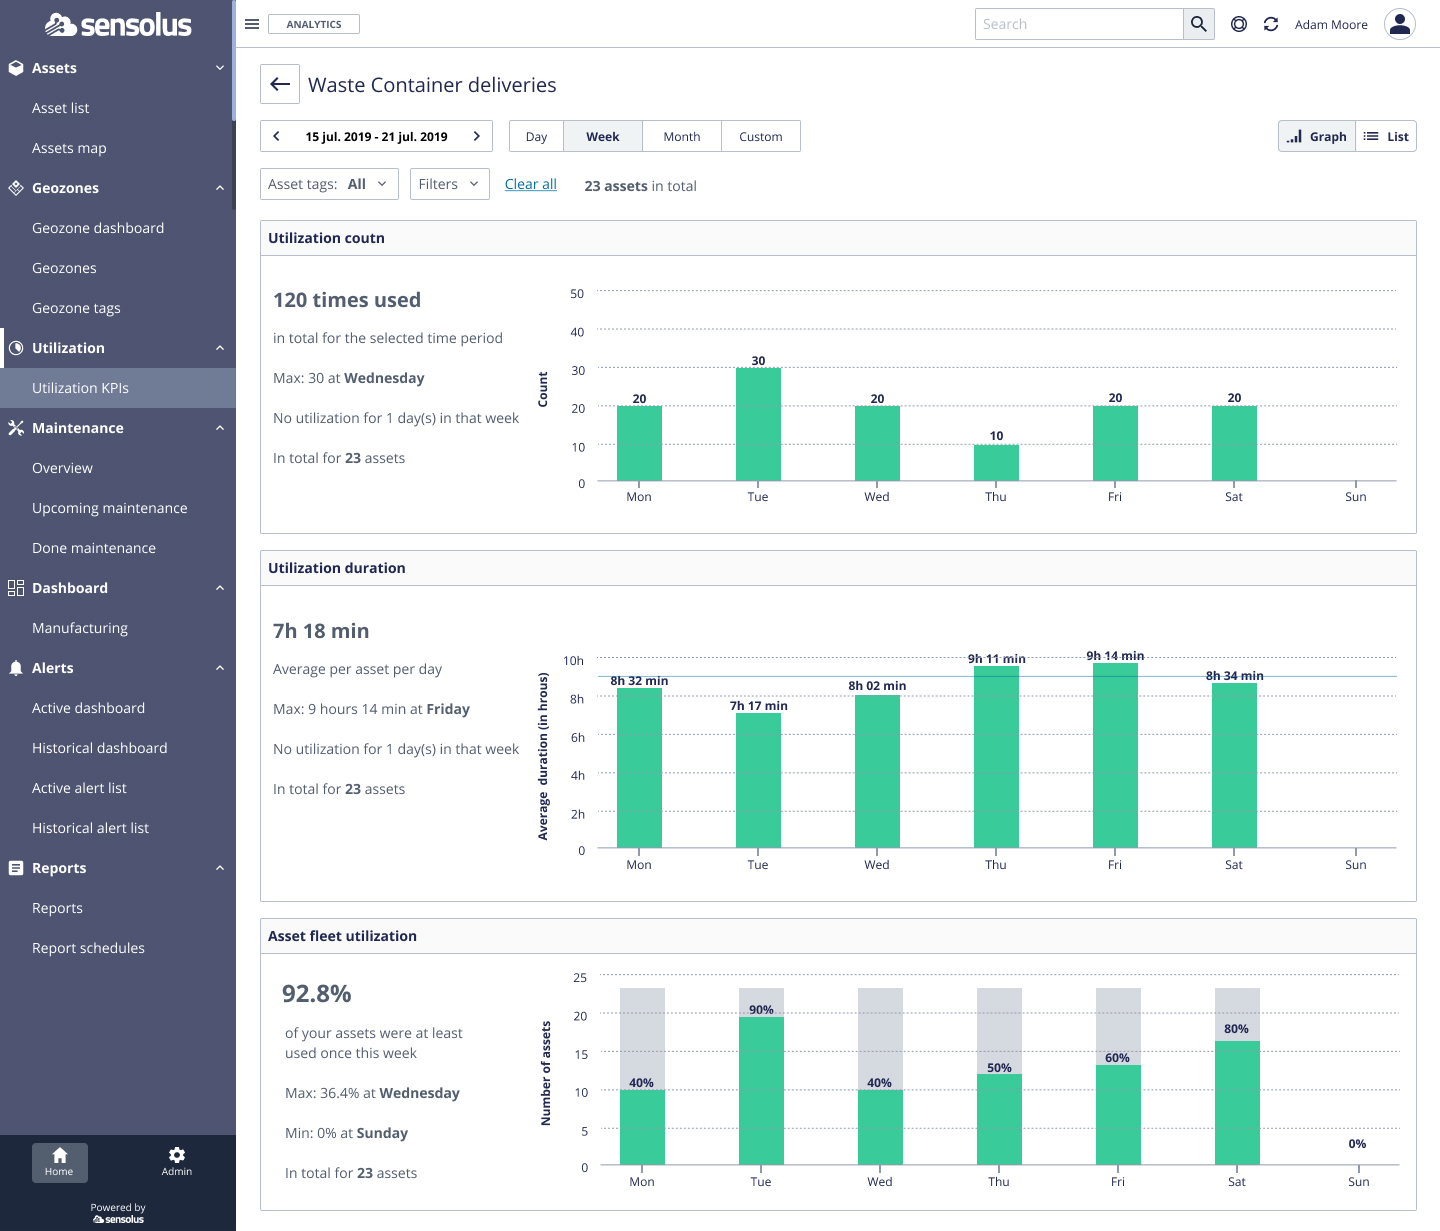
- The listview shows the columns selected when you created the utilization report. When
there is no data for that specific viewport you will get a notification on top of the
charts. Click Export to export the list as an excel file.
Notice:
- Utilization insights are automatically generated every Tuesday at 12:00 PM GMT for the previous week
- The first day of week is Monday. The exact day depends your organization configuration.
- Monthly data is rolled up at the end of the month
- When a new utilization KPI is created in the admin section, insights are automatically generated for the 3 previous months before the creation date, starting on the first day of that month