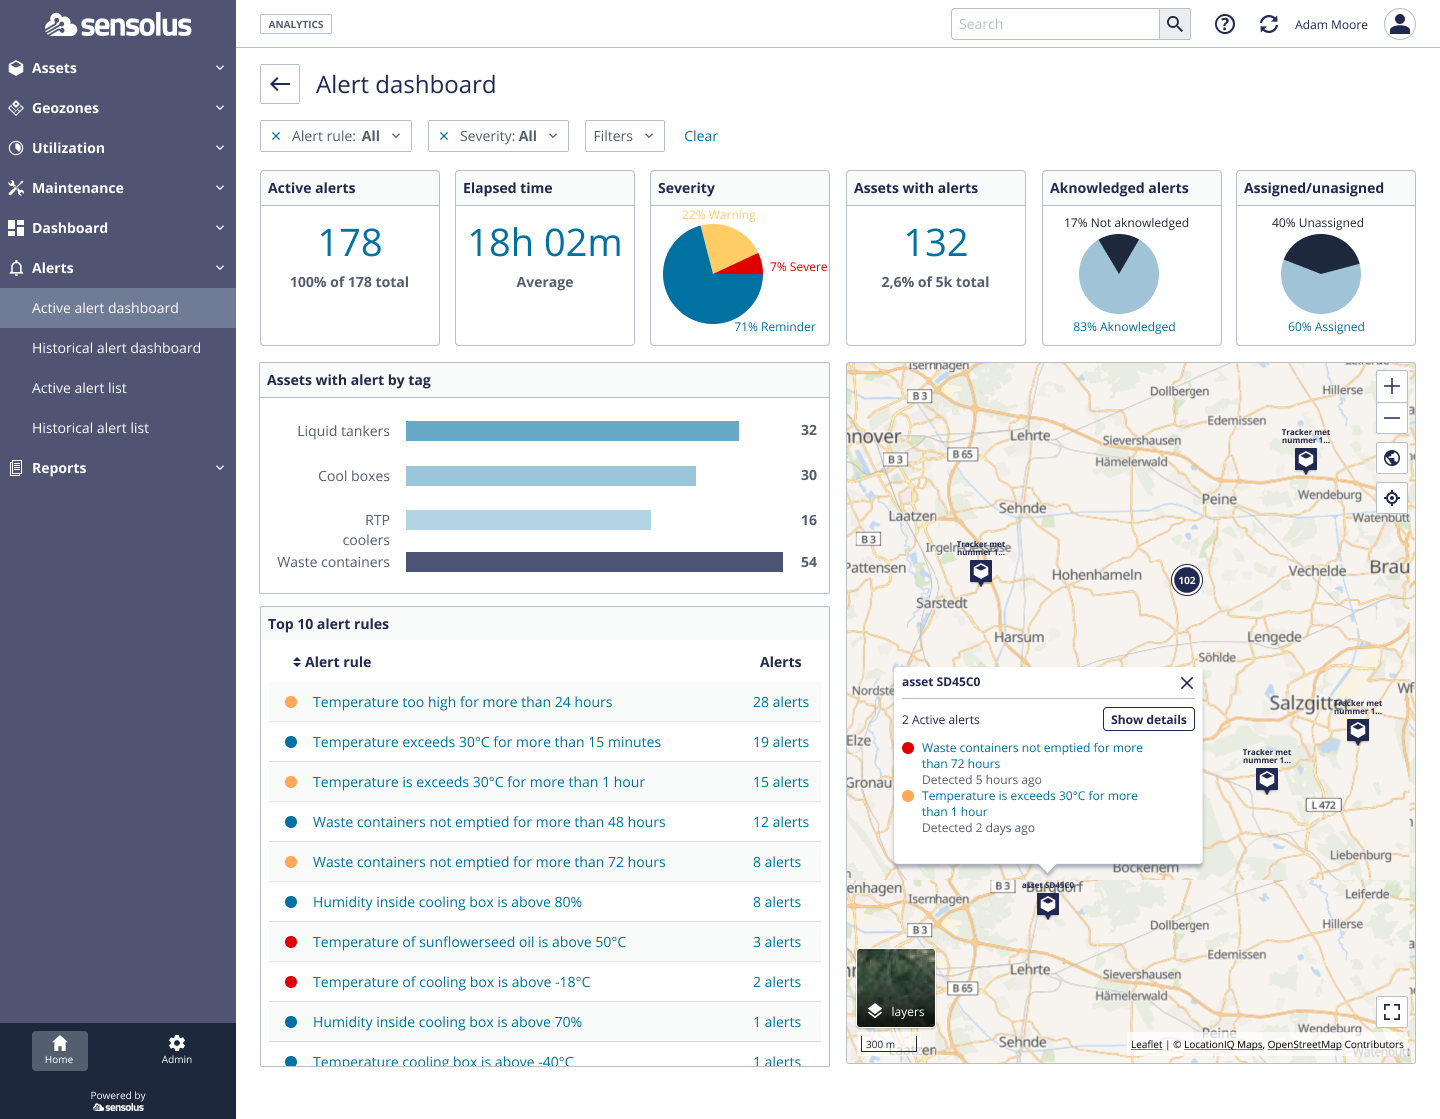
Active alert dashboard
The Active alert dashboard gives you insights on all the current alerts and some statistics on the active alerts. If you want to stay informed on all currently raised alerts for your assets, this is a good starting point to learn what's happening.
You navigate to the Active alert dashboard by going to  Home → Alerts → Active alert dashboard.


The dashboard consists of several widgets that display information on the active alerts from different perspectives. Use the filters to perform more in-depth analysis.
- Active alerts: the number of alerts that are currently active. Click on the number to go to the list to see which alerts are active.
- Elapsed time: the median of the active alerts.
- Severity: graph with distribution of alerts on different severity levels.
- Assets with alerts: number of assets (and % of assets) that currently have a raised alert. lick on the number to go to the list with assets.
- Top 10 alert rules: the top 10 of alert rules with the highest number of active alerts.
- Map: the assets with active alerts on the map.
- Assets with alert by tags: number of alerts distributed by asset tags.