Historical alert dashboard
The Historical alert dashboard gives you insights on all the past alerts and some statistics on the history of the alerts. If you want to look into the history of all alerts that have been active on your assets this is a good starting point to learn what happened.
You navigate to the Historical alert dashboard by going to  Home → Alerts → Historical alert dashboard.
On the dashboard you have different widgets with information on the history of the alerts and related assets. You can use the filter to adapt the dashboard to get more specific information and use the time filter to select for which period you want to get insights. For example, only about a specific alert or only alerts with a high severity level in a specific month.
On the dashboard you have different widgets with information on the history of the alerts and related assets. You can use the filter to adapt the dashboard to get more specific information and use the time filter to select for which period you want to get insights. For example, only about a specific alert or only alerts with a high severity level in a specific month.
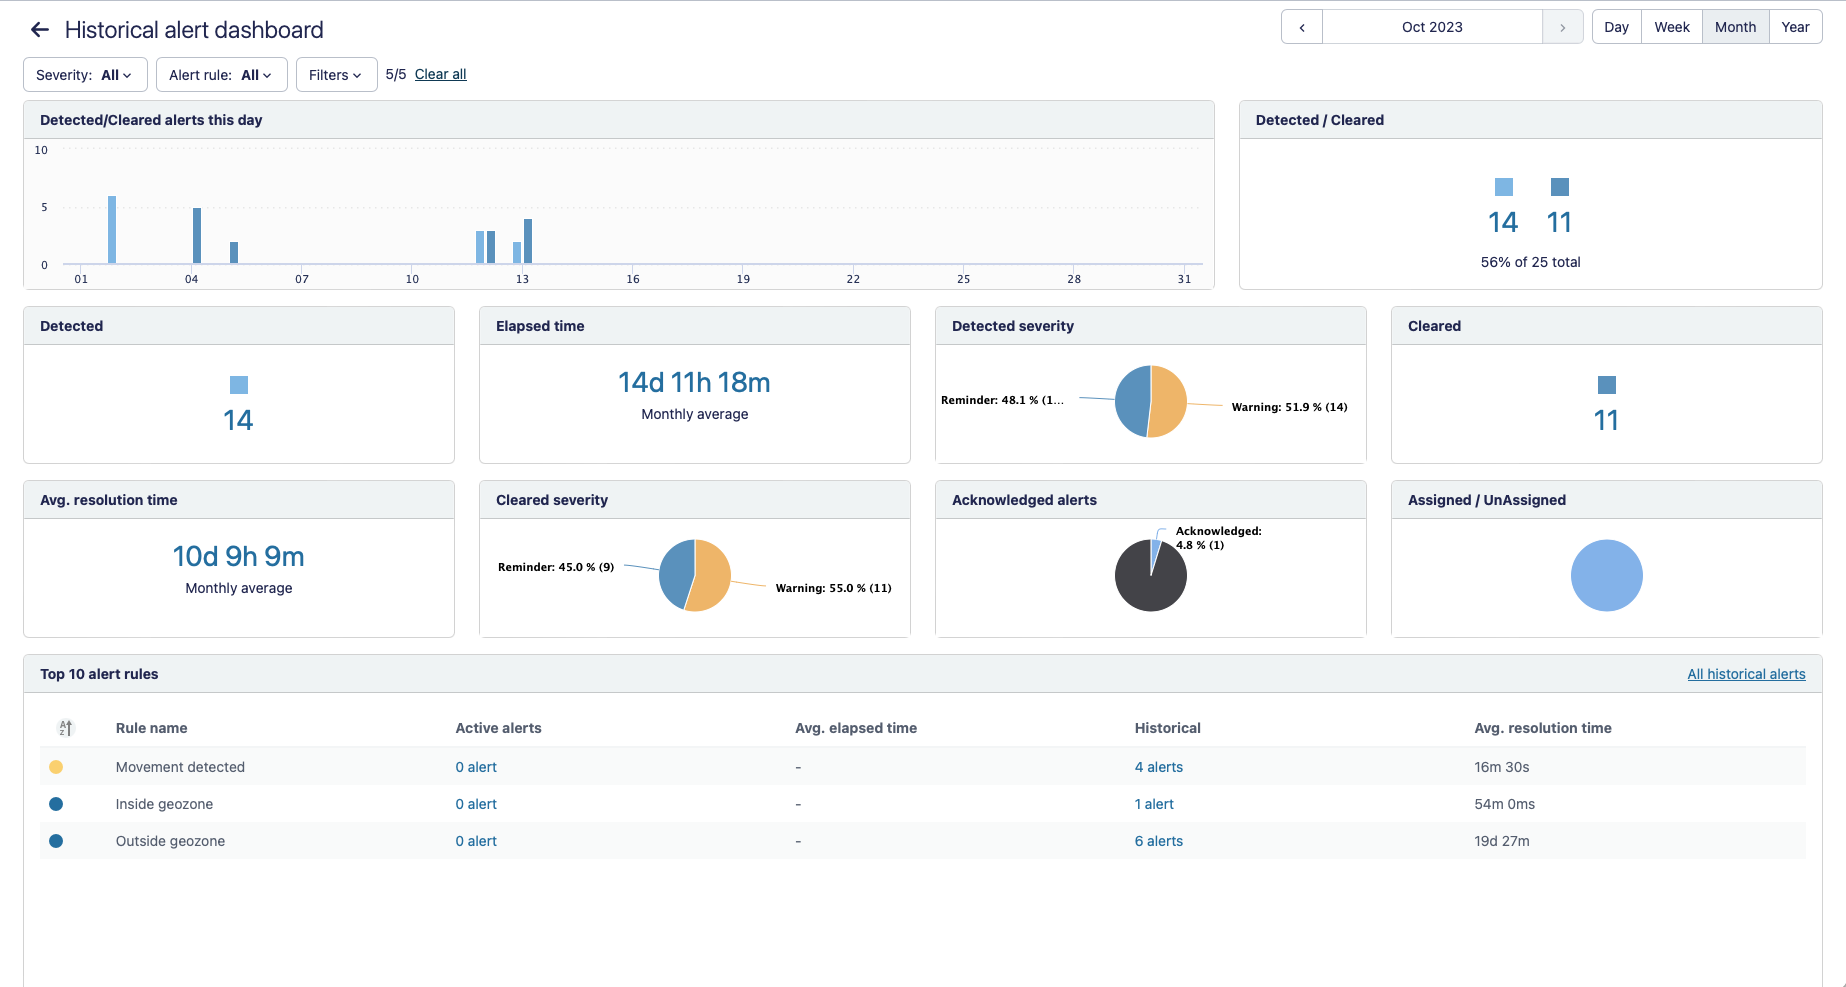
- Detected/cleared alerts this day: see how many alerts where activated and cleared on a specific day or hour. The light blue bar refers to the detected or activated alerts, the dark blue bar to the cleared alerts.
- Detected/cleared: the ratio between detected and cleared alerts (absolute numbers and percentage). This number tells you something about the balance between number of activated and solved alerts during a specific time period.
- Detected: total number of detected or activated alerts.
- Elapsed time: average of the elapsed time.
- Detected severity: distribution of the new active alerts on severity level.
- Cleared: total number of cleared alerts.
- Average resolution time: the average time duration between the activation and the clearance of the alerts during the selected time period.
- Cleared severity: distribution of the cleared alerts on severity level.
- Top 10 alert rules: list of top 10 raised alert rules during the specified time period.