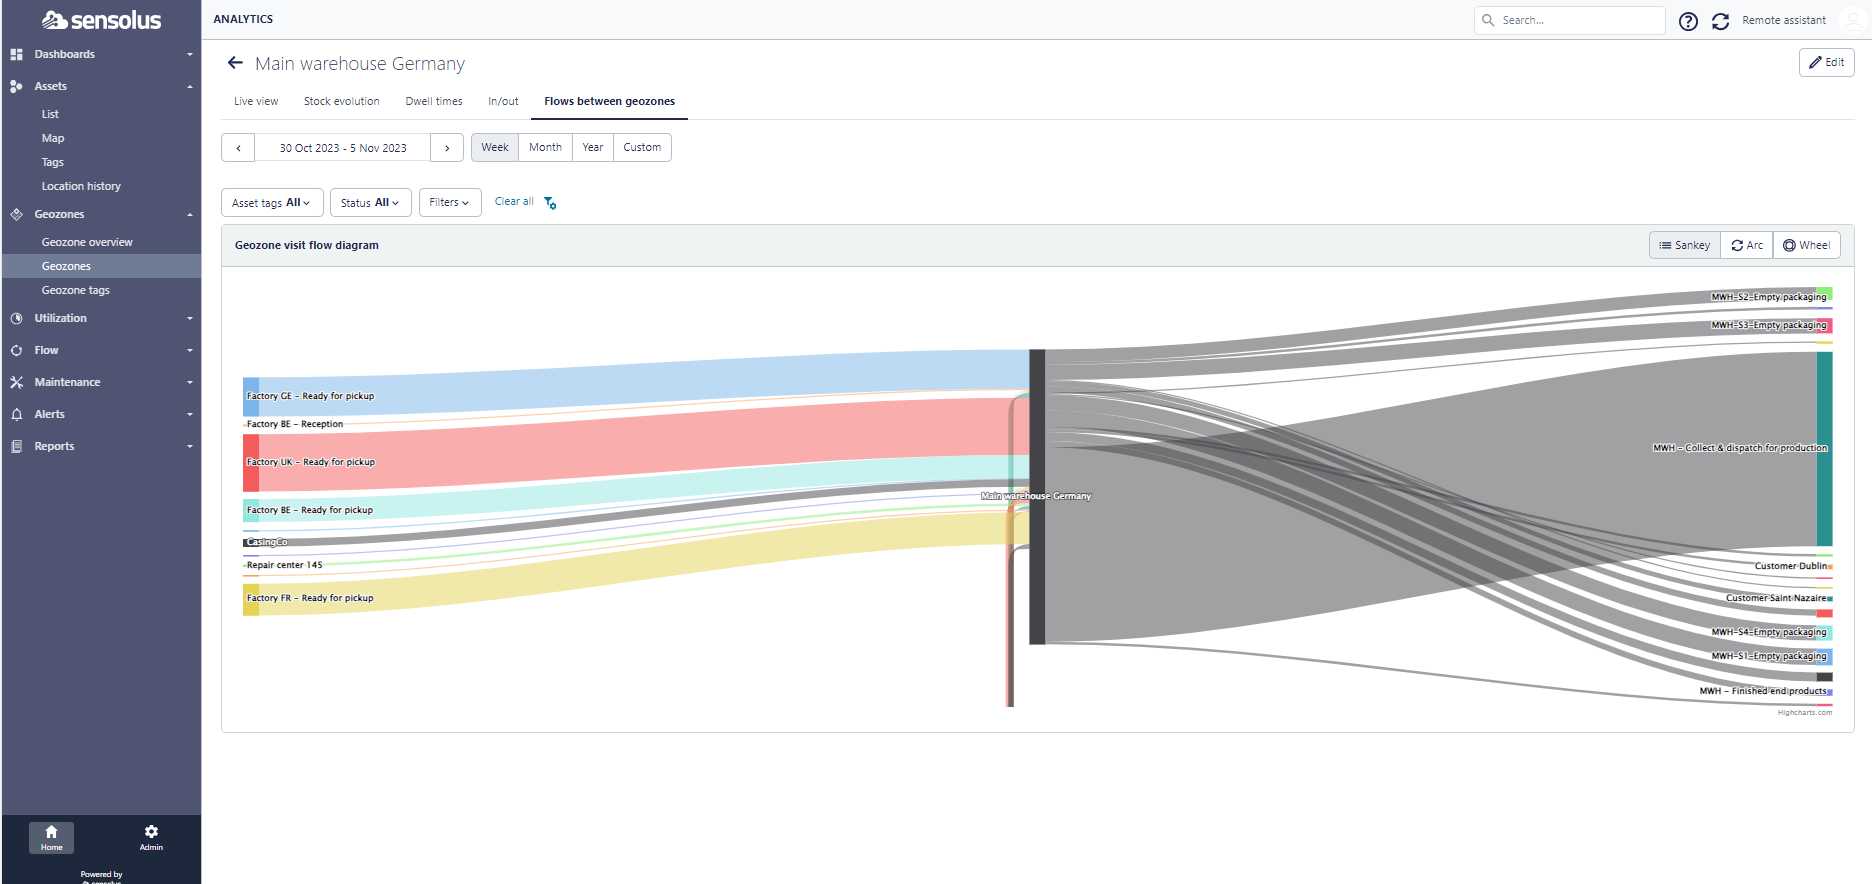
Single geozone: flow between geozones
Explanation on the single geozone flow page
In this view the flow of assets, or how they are moving, towards or from the single geozone
is shown. It is possible to select the time window of the flows you want to be shown. You also
have the filter controls here to set time range and filter on assets, geozones or another type
of information.


You can choose between 3 visualizations: a sankey flow diagram, arc diagram or wheel diagram.