Single geozone: Dwell times
The dwell times view provides insights into how long assets stay within a specific geozone.
The dwell time of assets in a geozone informs you on the duration an asset stays in the geozone, or how many assets stay for how long in the geozone.
The Dwell times view contains different widgets with following information:
- The time filter.
- The asset filter.
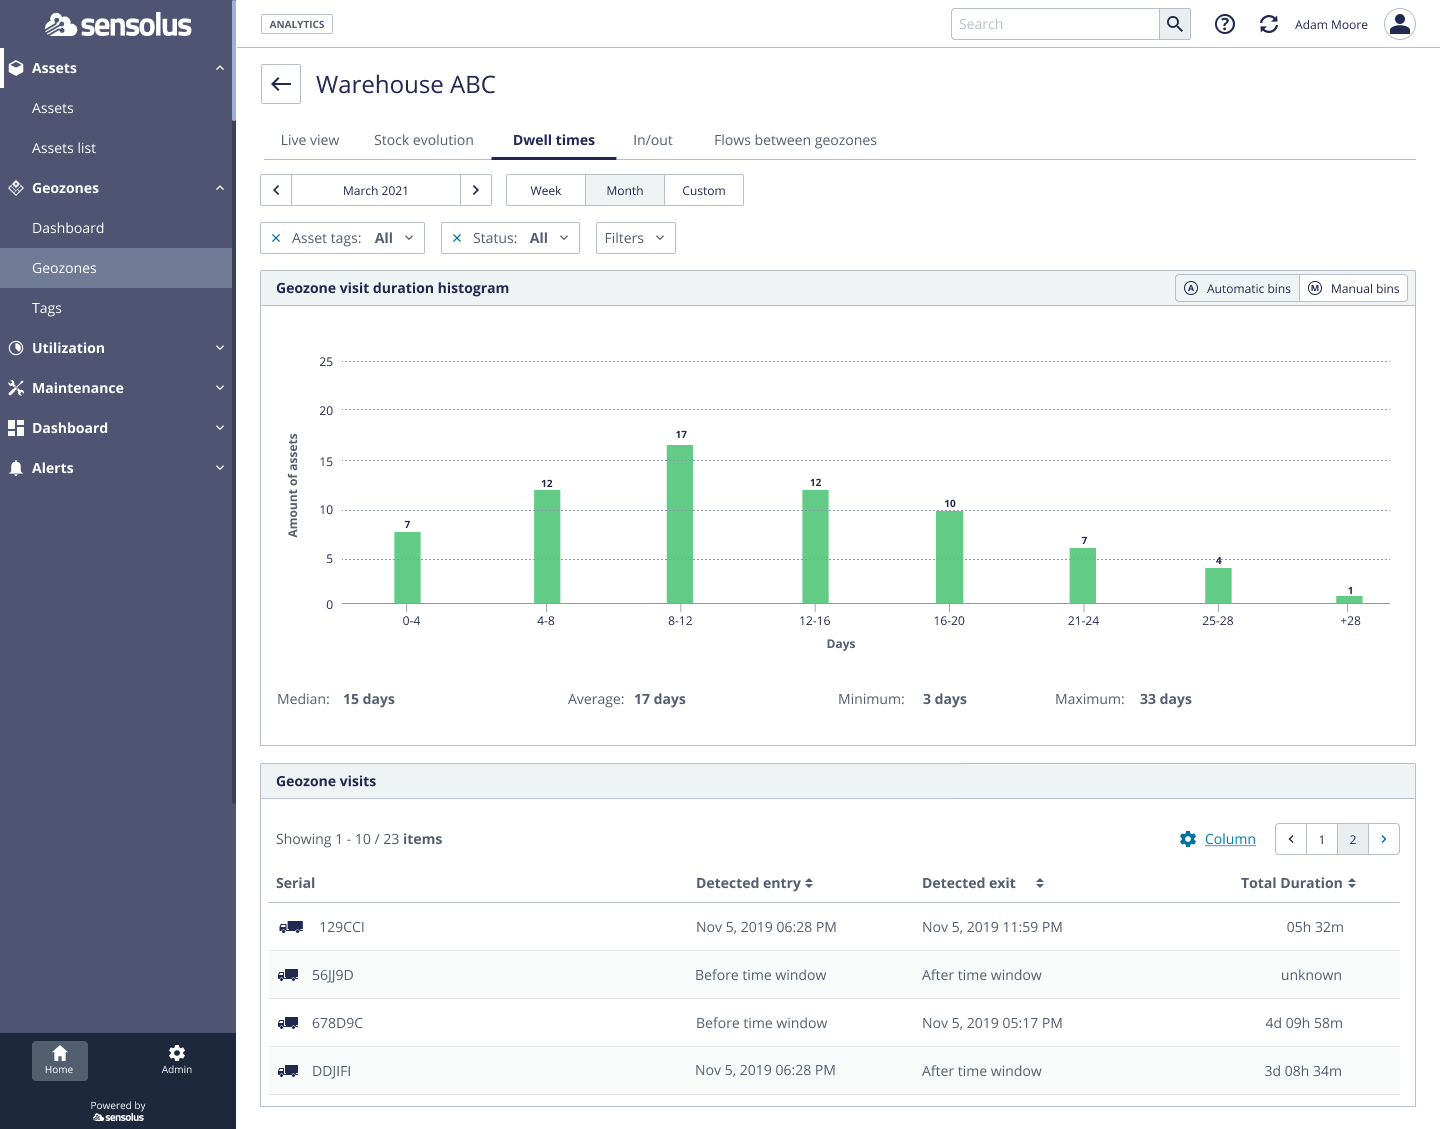
- Geozone visit duration histogram: shows the number of assets mapped on the duration of a geozone visit. In this way it is possible to see for example how many assets have had very long geozone visits.
- Geozone visits: (bottom panel): click a single bin of the histogram to get a list of the assets with the selected visit duration range (for example 0-1 hour).
Automated and manual bins
In the histogram the distribution of the duration of the geozone visits on the X-axis is defined automatically depending on the duration of the geozone visits of the different assets in the geozone.
As this may create outliers as some assets just got stuck in the geozone, it is also possible to configure the bins in a manual way.
To do a manual creation of bins, select Manual bins in the  selector in the top right of the widget
top bar.
selector in the top right of the widget
top bar.
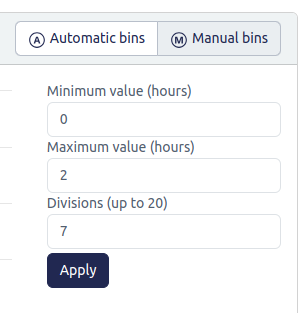
Click the  Save button and the
lay-out of the histogram will change. The X-axis is now using the bins you manually
created.
Save button and the
lay-out of the histogram will change. The X-axis is now using the bins you manually
created.