Single geozone: in/out flow management
Write short description here..
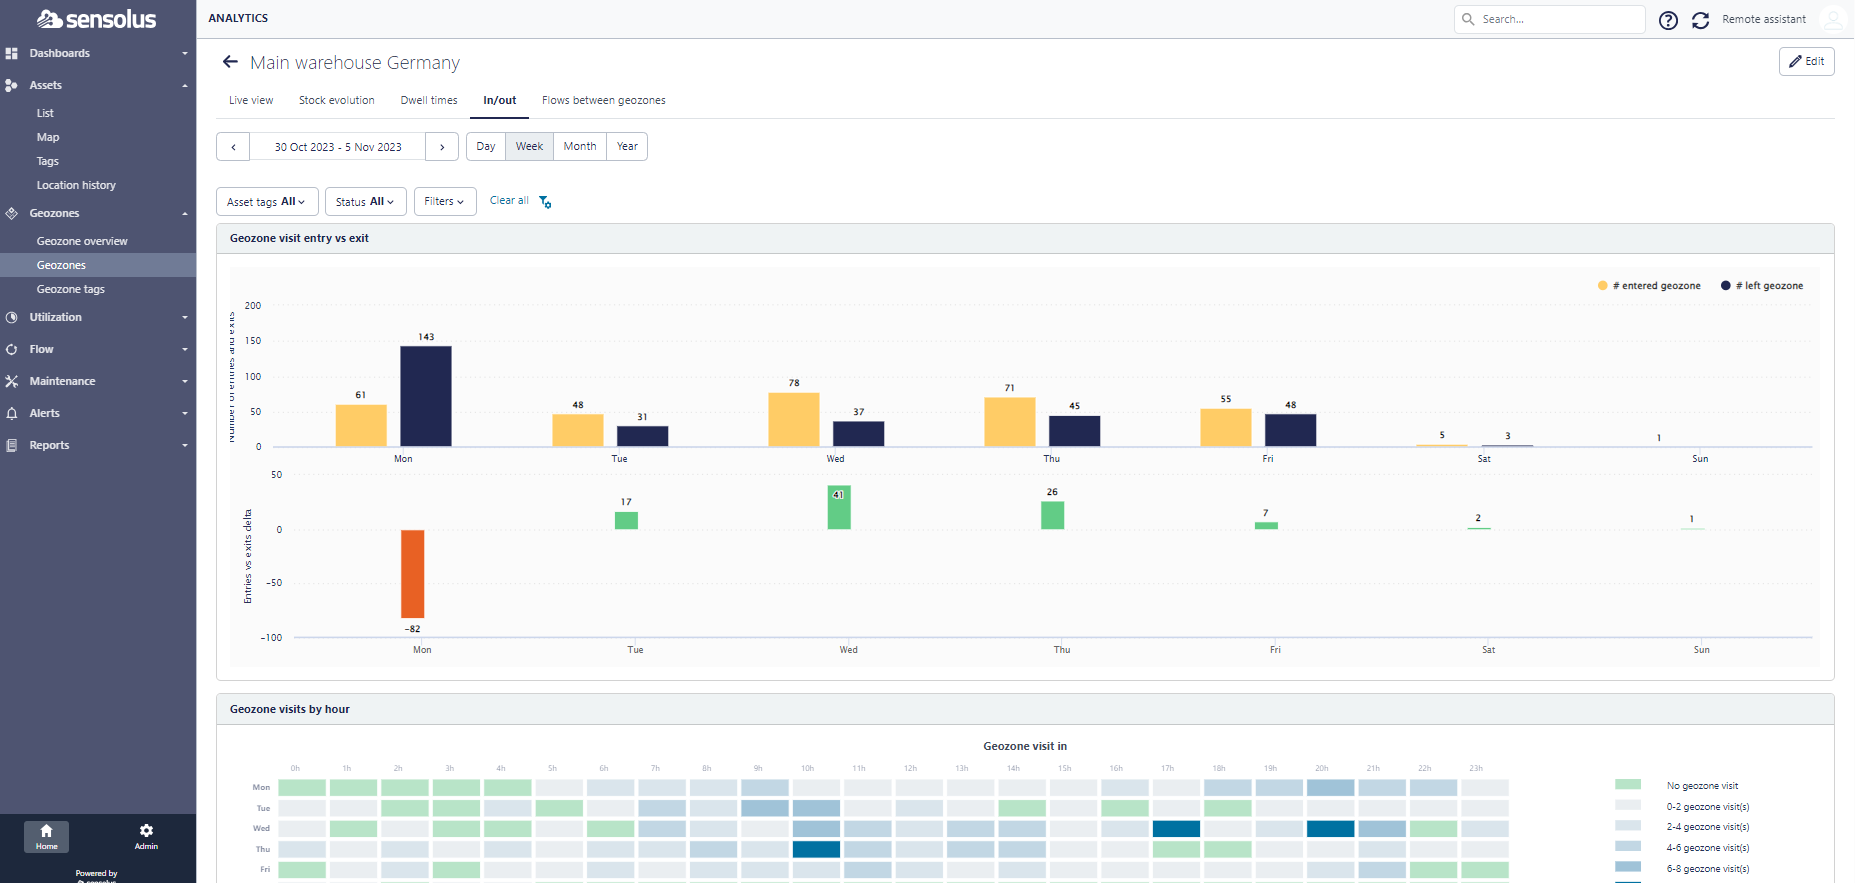
Click the In/Out tab to see the in/out flows of the geozone. This is a visualization of the number of assets that entered and left the geozone at a specific day/week/month. This is calculated using the geozone visits of an asset.
The top chart shows the number of assets that entered and left a geozone in the selected time window. The bottom chart shows the net difference. This one is especially useful when you have a large number of assets where the Y axis of the top bar chart scales out a lot. This page also has a heat-map view.