Design custom dashboards by adding widgets
Explanation on how to create custom dashboards
Design dashboard
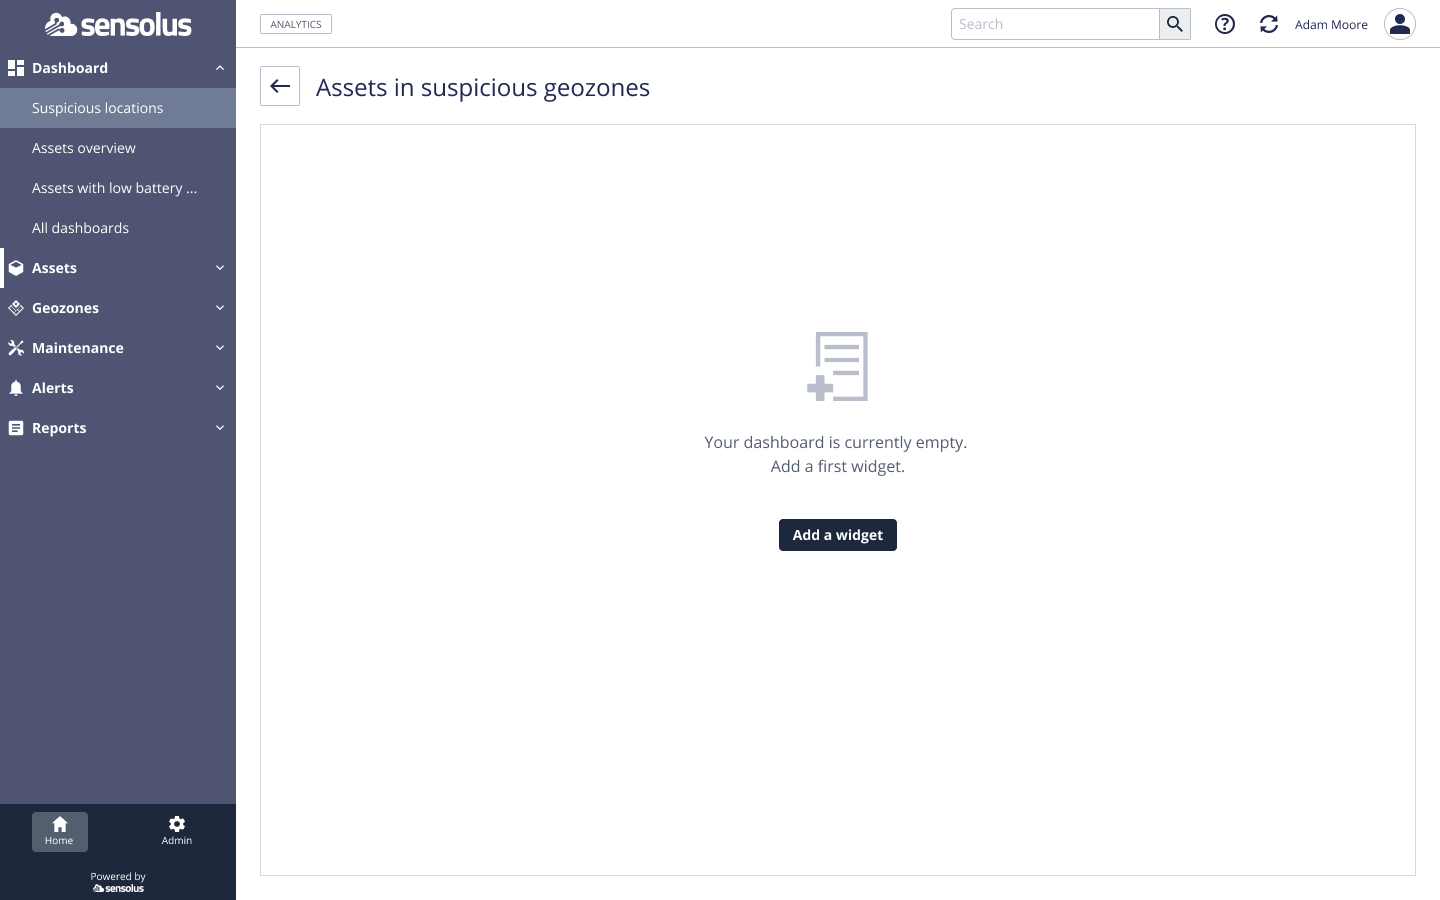
This is the empty dashboard you start from. Click  to add your first widget to the dashboard.
Following pop-up window appears with the widget data types you can add to your
dashboard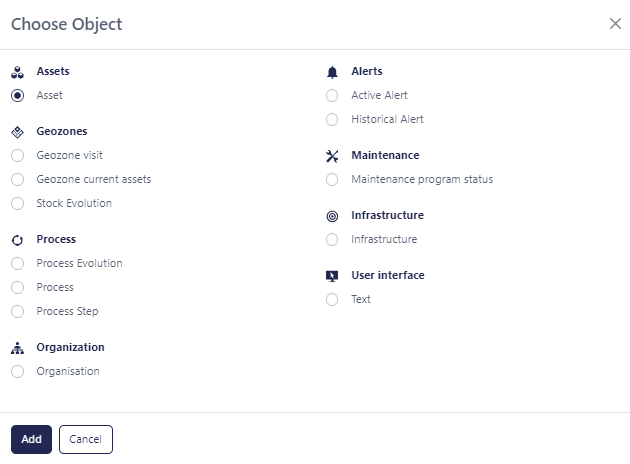
Depending on your platform subscription plan you have access to different widget data types
| Widget data type | Essential | Professional | Analytics | Partner |
|---|---|---|---|---|
| Assets | ||||
| Assets | x | x | x | x |
| Location history | x | x | x | x |
| Geozones | ||||
| Geozone visit history | x | x | x | |
| Geozone activity stream | x | x | x | |
| Geozone current assets | x | x | x | x |
| Stock evolution | x | |||
| Dwell time | x | |||
| In/out | x | |||
| Maintenance program status | x | x | ||
| Processes | ||||
| Process | x | |||
| Process evolution | x | |||
| Process step | x | |||
| Organizations(only for partners) | ||||
| Organization | x | |||
| Alerts | ||||
| Active alerts | x | x | x | x |
| Historical alerts | x | x | x | x |
| Maintenance | ||||
| Maintenance program status | x | x | ||
| Infrastructure | ||||
| Infrastructure | x | x | x | x |
| User interface | ||||
| Text | x | x | x | x |
| Group column | x | x | x | x |
Configure widget
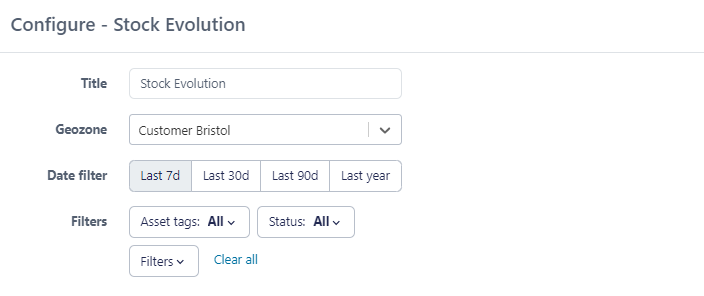
The configuration fields depend on the type of data widget type you selected to add.
Different chart types exist, sometimes you can select which chart type you prefer, sometimes the system decides for you (for example, with the stock evolution data type)
The "classical" filtering, column configuration and column count functions available on the Sensolus platform can also be used in the different widgets.
Don't forget to click the  Save button after configuration of the
widget.
Chart types
Different chart types can be used in the custom dashboards.
| Chart type | Example |
|---|---|
| Table chart | 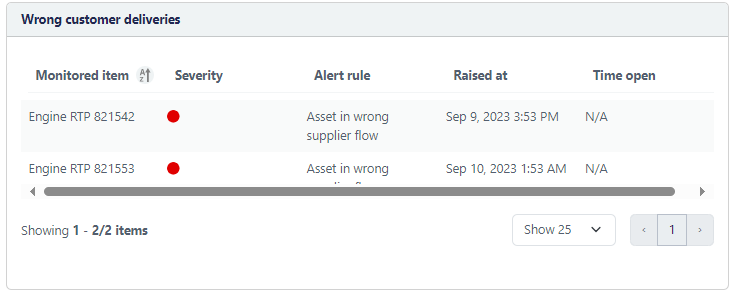 |
| Pie chart | 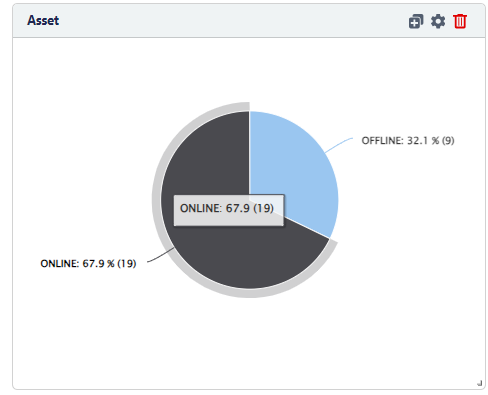 |
| Bar chart (vertical and horizontal) | 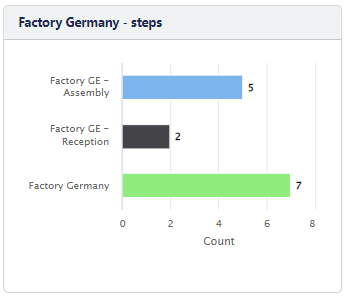 You can select the chart size: (max 25-50-100 or 200 bars) |
| Big number chart | 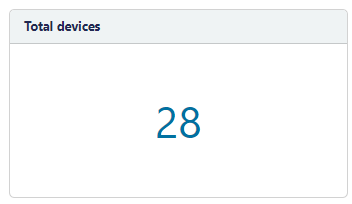 |
| Asset map | 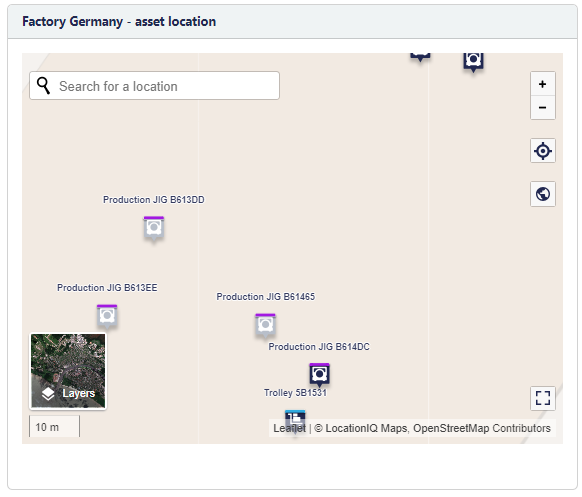 |
| Geozone activity stream | 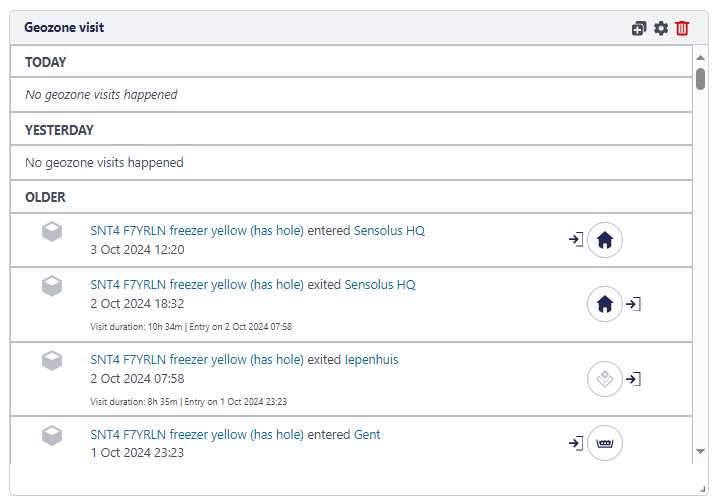 |
Duplicate, edit or delete widget
To edit the configuration of a widget go to Home → Dashboards → select the dashboard of the widget you want to edit.
Select  on the dashboard.
 : make a duplicate of the widget, ideally
to use if you want the same widget, but from for example a different geozone.
 : edit the configuration of the
widget.
 : delete the widget (the widget is never
kept, it is fully deleted).
Widget is not available
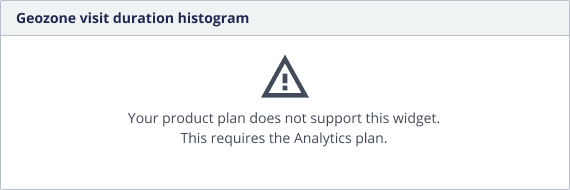
As different plans give access to different data widget types and partners can create and share dashboards with their organizations, it is possible that they share a dashboard created with for example data widgets only available to Analytics plan with you, who has only access to the Essential plan. When this happens the dashboard will still be shown to you, but the widgets with data types that are not part of your plan will give an error message.
The error message is as following
