Import Sensolus data
Different ways to import Sensolus data to Power BI
In order to visualize data you first need to import it in Power BI. You can import multiple datasets and combine them. The easiest is to import an Excel report downloaded from the Sensolus platform. Because this is a manual operation it is not possible to automatically refresh the imported data. You will have to import a new Excel report on Power BI and republish the report before the users will see the up-to-date information. The better alternative is to automatically update your report with the newest data. Therefore we will use different ways of importing data where there is the possibility to get up-to-date information by refreshing it automatically.
Scheduled reports
The Sensolus platform has the functionality to automatically create reports. These scheduled reports run periodically and can be downloaded from the platform. Instead of importing a downloaded report in Power BI, you can use the Sensolus API to import the latest report. This has the advantage that you can refresh your report and it will import the latest report.
Every report scheduled gets an ID. You need this ID to
specify which report should be imported. Navigate to ![]() Home → Reports → Report schedules and click on the
Home → Reports → Report schedules and click on the ![]() view icon of
the scheduled report you want to import.
view icon of
the scheduled report you want to import.
From the URL you can identify the reports ID. Look to the latest characters of the URL and you will see something like …&id=1234, in this case the ID of the report is 1234.
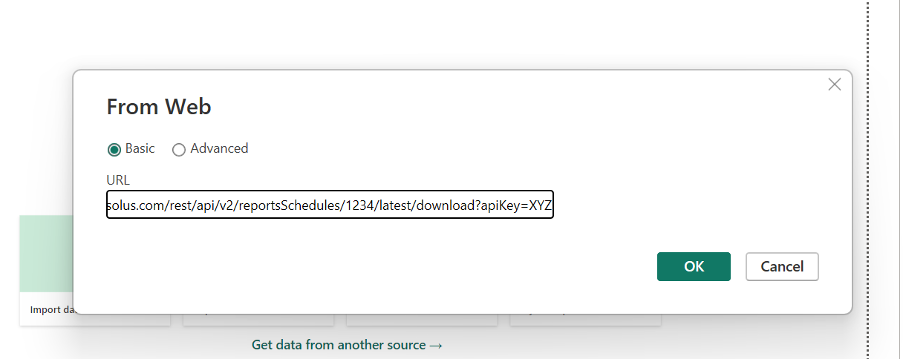
The API call needed to import this report is in this example case: https://cloud.sensolus.com/rest/api/v2/reportsSchedules/1234/latest/download?apiKey=XYZ (where you replace the 1234 with the ID of your report and fill in your API key instead of XYZ).
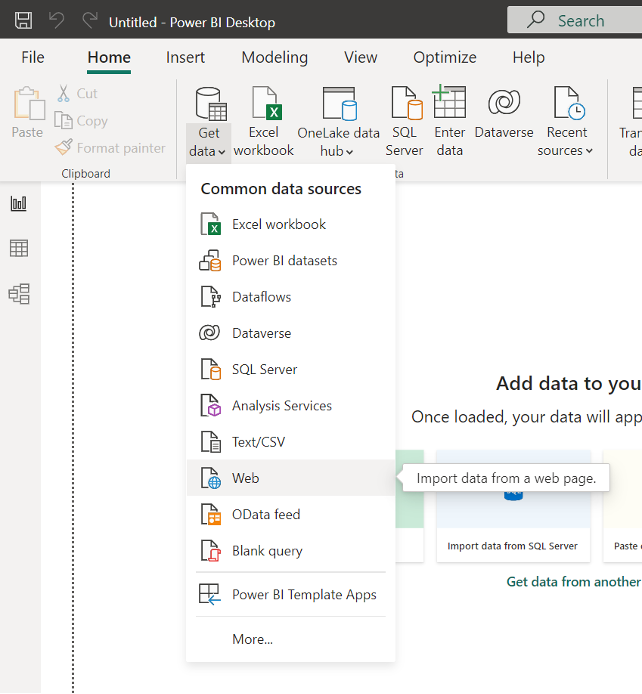
In Power BI Desktop go to Get data → web and paste the API call and click OK.


Sensolus API
Power BI has the possibility to import data via API and Sensolus has an extensive API to get data from your organization. You can thus configure a Sensolus API call as input source for Power BI. Every time you will refresh the Power BI report, the API call will be executed and new data will be downloaded into your report. This works fine for API calls that are looking over all devices, geozones, alerts,… It is not so useful for API calls that only get data of one entity.
For example the API call to get locations history of one tracker is not useful. If you have installed 1000 trackers this means you will have to configure 1000 input sources, 1000 API calls, one for each device. This is not scalable and therefore we advise to use a Python script (see below).
In Power BI Desktop go to Get data > web and paste the API call and click OK .
Python script using Sensolus API
The third and most complex option is to use a Python script that executes multiple API calls. This is useful in the case where a Sensolus API call only gets data from one device. You need to install Python on your computer and enable Python scripts in Power BI. The easiest is to let the Python script create Pandas dataframes, that can be imported in Power BI as report.