September 12, 2023
Explanation on the platform release 5.5.5 for organizations
Tracker diagnostics
Until now a customer could ask to view the diagnostics information of their trackers. From now on, a customer will have access to this information by default. Diagnostics information are interesting for better follow-up of the configuration, installation, roll-out and working of your trackers.
New tracker diagnostic: number of trackers with at least a major issue
To clarify the difference between minor and major issues on trackers, a new metric is added to the tracker fleet diagnostics. The new metric is added to the graph Trackers with an issue. From the moment one tracker has a major issue, a dark blue point/line will appear which shows the (number of) trackers with a major issue(s).
New report types: upcoming maintenance & executed maintenance
Two new reports are added, dedicated to better maintenance follow-up.
Input infrastructure location by bringing in latitude and longitude
Until now you had to navigate on a map to position your infrastructure device . Now a longitude and latitude field are added. This makes it possible to position your infrastructure based on this input instead of navigating to a location on the map. (add link to updated documentation)
Device messages
The device messages of a single tracker are now visualized for every account on the platform. You find the device messages on the Tracker details page in the Device message tab.
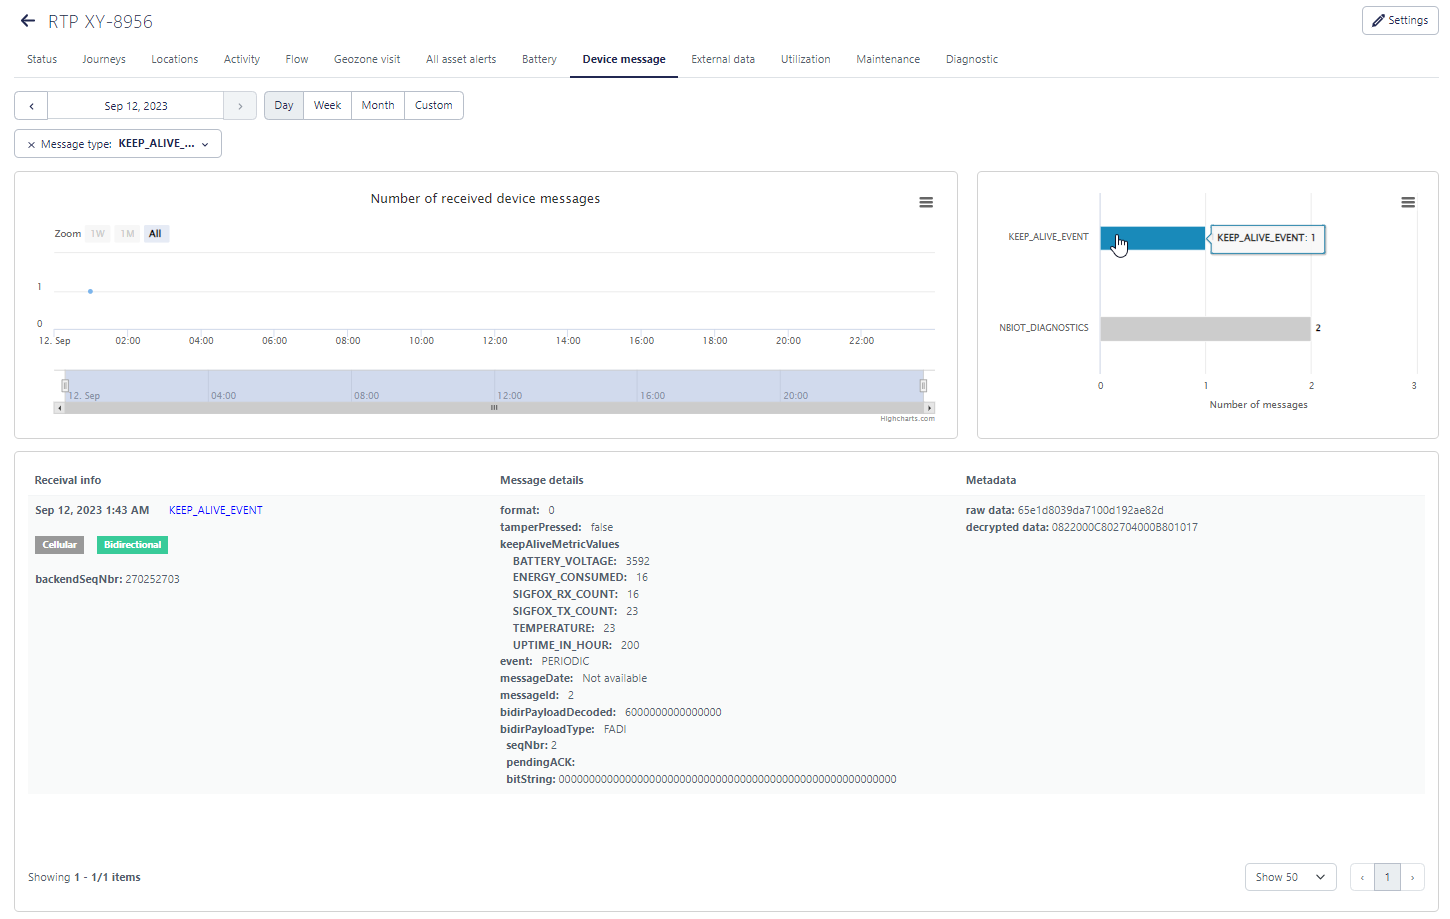
- some fields are grouped to make the messages easier to analyze
- a graph is added with counts of message information
- by clicking on a bar in the graph the selected message type is shown in the panel below.