June 7, 2023
Platform release notes 5.5.2
Rework UI and geolayers interaction on maps
A map contains a set of buttons to change the lay-out, format or information on the map. Some small changes have been made and a total rework of the geolayer functionality has been implemented in this release.
Most important changes:
- legend and geolayers have been merged in one button
- UI to show geolayers on the map has changed & a set of default geolayers are defined and shown on each map.
- New interaction to create geolayers
The current UI of the maps and geolayers are available in the documentation.
Simplification of creation of utilization insights
The creation of utilization insights have been simplified. No pre-processors anymore. Select one or multiple utilization metrics that match the definition of what "utilization of an asset" means for your use-case and the dashboard with the insights is directly available.
We've updated the documentation on utilization in the documentation center here.
Run a scheduled report immediately
The possibility to immediately run the report when creating a schedule for it is added.
This function can be accessed by clicking the ![]() button in the scheduled report
list.
button in the scheduled report
list.
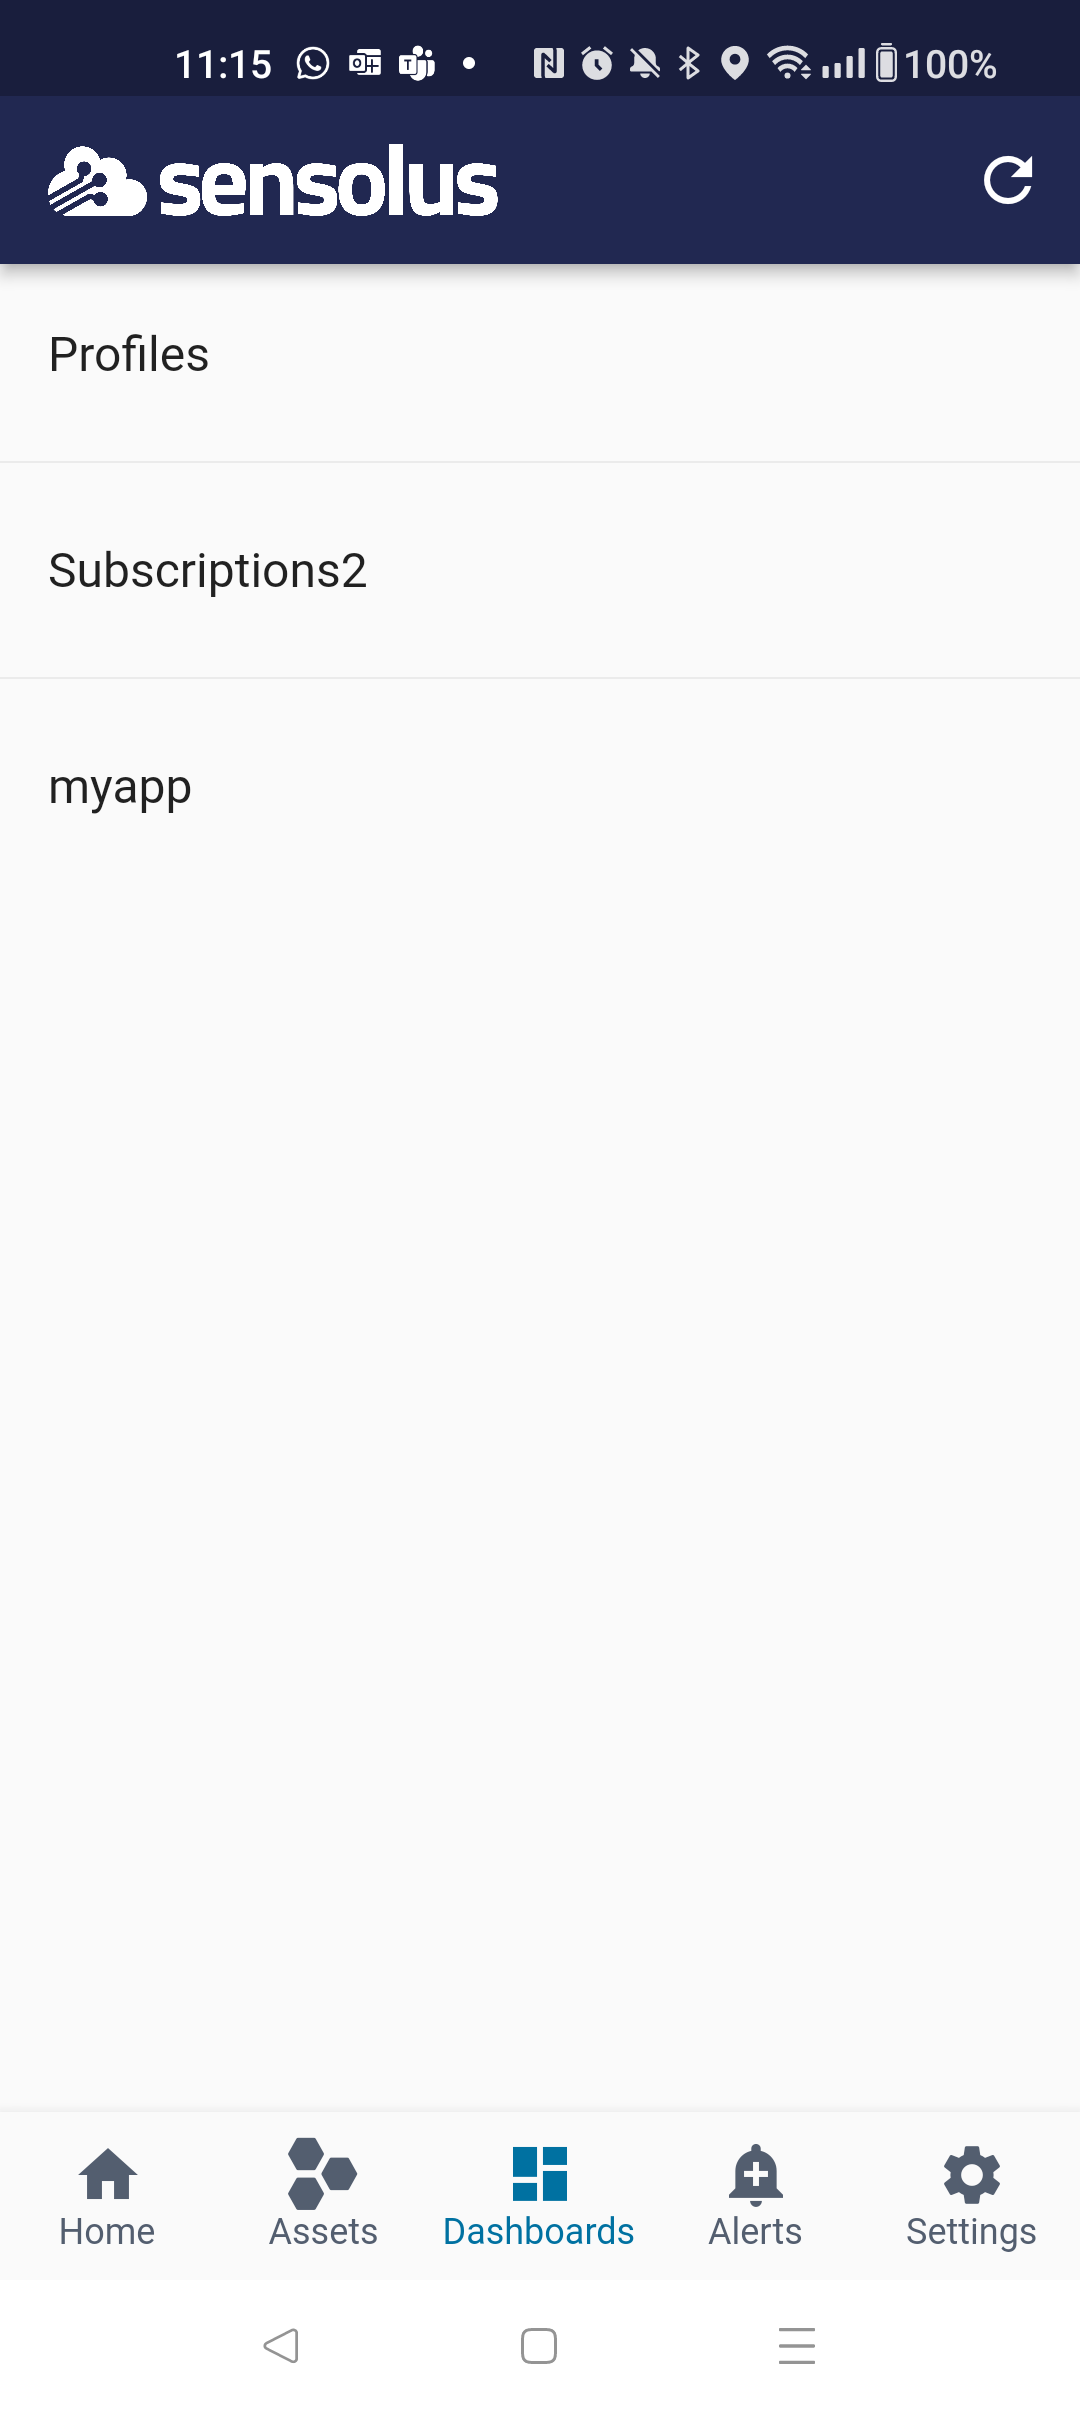
PowerBI dashboards available on Sensolus mobile app
From now on it is also possible to show PowerBI dashboards on the Sensolus native mobile app (Android & iOS)
Geozone visit report converted to use persistent
Geozone visits reports do not use live data. The data it uses is stored in a database. This means the data must already be available in the database before it can be shown in the report. When you just created a new geozone and try to download the geovisit report, this geozone will not be part of the geozone visit report. The reason for this is it will only start to take this new geozone into account from the moment it was created.