April 16, 2024
Public release notes of release 5.6.3
New language added: Spanish

We added a Spanish platform version. The platform is now available in English, French, Dutch, German and Spanish
New alerts: infrastructure and sensor low battery
Different new alerts are added to the diagnostics alerts in the alert library.
- The "Infrastructure has low battery " alert will notify you if the estimated battery level of an infrastructure device is low (below 20%)
- The "Sensor has low battery" alert will notify you if the estimated battery level of a sensor is low (below 20%)
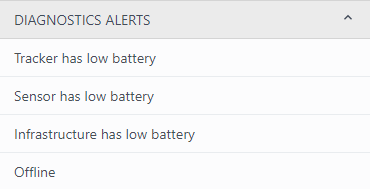
In addition, we reworked the lay-out of the tracker low battery alert, but the functionality is still the same.
Show duration of report generation
As some reports take long to create, we added some information on the estimated duration of the generation of a report to explain to the users what to expect and don't make them worry.
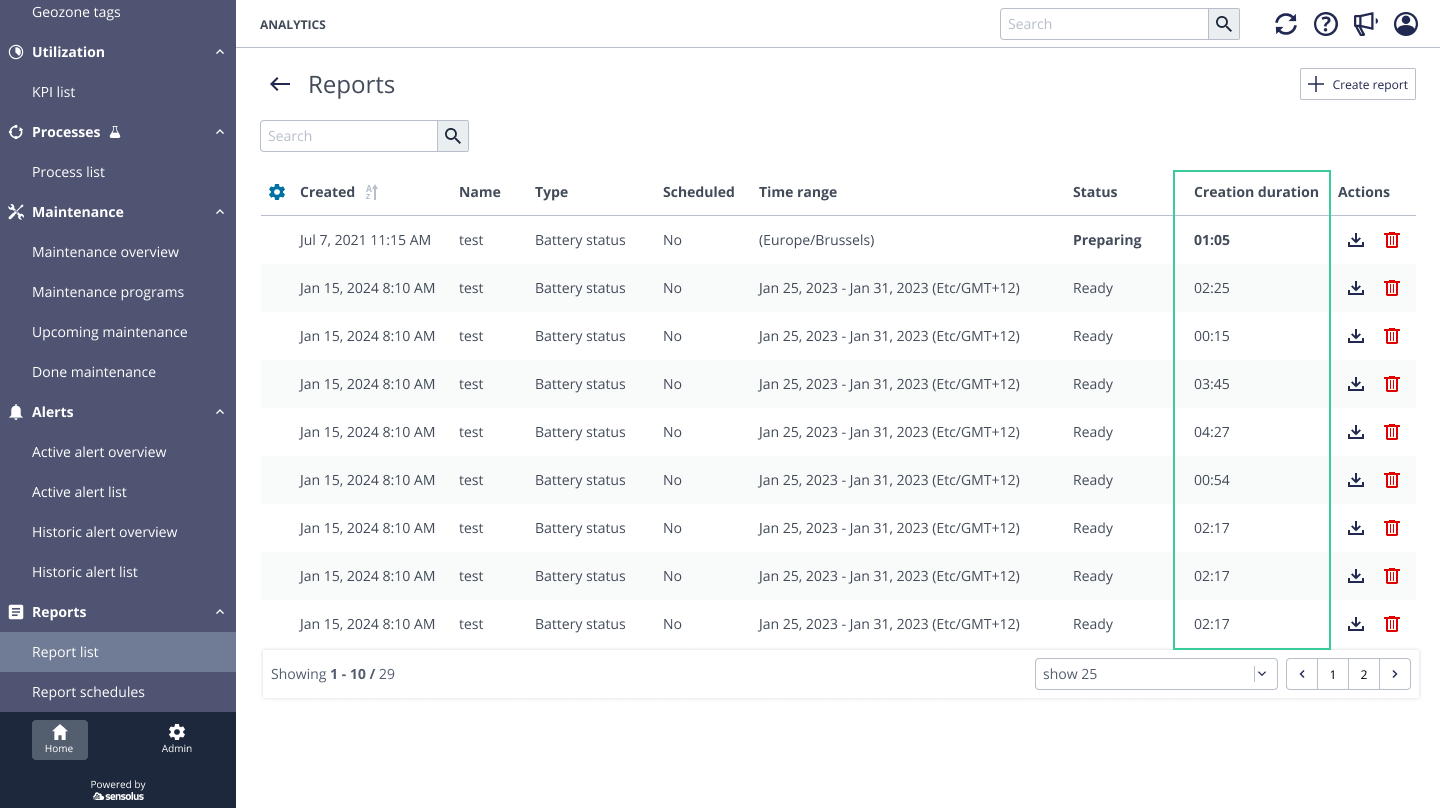
If you don't see this information in the report list, add the "creation duration" column to the list lay-out by changing the column settings.
Firmware information added to tracker info
The firmware version is added to the tracker information on the platform.
Firmware is the software programmed on the tracker itself. It is what we call the 'embedded' software or 'edge computing'. Sensolus trackers all have dedicated firmware. Each delivered tracker comes with a firmware version. Firmware can also be upgraded if needed (over BLE and for specific trackers Over the Air -FOTA-). Until now the firmware version of the tracker was not visible on the platform.
External BLE sensors list: restructured and extended.
- serial number of the linked tracker
- status of the linked tracker
- applied (and pending) profile on the linked tracker
- Manufacturing serial
Asset trackers list: extended with sensor information
- Sensor summary
- Sensor serial
- Sensor type
- Sensor status
Unlinked sensor shown in different place
When a user unlinks a sensor the last sensor value was still displayed in the asset status page. We now removed the unlinked sensor from the asset status page and have an indication in the external sensor tab that a sensor was once linked to the tracker and show the data date it was removed. The user can still access the historical data.
Clean-up of tabs on Infrastructure info page
As the infrastructure info page was using the tracker info page as template, some tabs were irrelevant which made the interface confusing. Therefore a full clean-up of the tabs on the infrastructure info pages of the different infrastructure types (ZA 3500, geobeacons,…) is done in this release.
- Overall changes made:
- Renamed "Tracker configuration" to "configuration".
- Removed tabs from the infrastructure devices that are irrelevant.
- GB 3000 specific changes:
- MAC address of the geobeacon added
- "Last seen tracker serial" added next to the "Last seen date".
Updated too long in geozone alert
If you create a 'too long in a geozone' alert and add several geozones to the alert, then a problem could arise when a tracker traveled from one geozone to another geozone that was mentioned in the alert. Until now an alert was only triggerd if the asset was evaluated as being in none of the mentioned geozones. This has now been changed. An alert will be triggered if the asset was evaluated as not being any more in one single geozone, not in the group of geozones. In fact, this is just a more logical working of the 'too long inside geozone' alert.
Enterprise security add-on: extension Audit logs
In the Audit log (only accessible to organizations with the Enterprise security add-on) we extended the provided information. Next to logging the changes made, we also log the user login, IP address and the used browser type now. You can see the changes by going to Admin → Access Management → Audit log.